Advertisement
Is Constellation Software Worth a Second Look After Recent 24% Share Price Decline?

Simply Wall St
Reviewed by Bailey Pemberton
- Wondering if Constellation Software is a bargain or overhyped at its current price? You are not alone, as investors are sizing up whether now is the time to get in or wait on the sidelines.
- After a strong run in recent years, the stock has retreated, down 14.0% in the last month and off 23.9% over the past year, making some wonder if its growth narrative or risk perception is shifting.
- Recent headlines have focused on Constellation's continued acquisition strategy and the broader pressures facing software stocks, with market chatter swirling about sector re-ratings and technology valuations in today's climate. This wider context could help explain the recent price dips and may set the stage for new opportunities.
- Currently, Constellation Software scores a 3 out of 6 on our undervaluation checks. Let's dig deeper into the main valuation approaches, and keep an eye out for a smarter perspective that goes beyond the usual numbers, coming up later in the article.
Find out why Constellation Software's -23.9% return over the last year is lagging behind its peers.
Approach 1: Constellation Software Discounted Cash Flow (DCF) Analysis
A Discounted Cash Flow (DCF) model estimates a company's intrinsic value by forecasting its future cash flows and then discounting those amounts back to their value today. This method gives investors a data-driven way to gauge whether Constellation Software’s shares are a bargain or overpriced based on core business performance, not just market sentiment.
Currently, Constellation Software generates an annual Free Cash Flow (FCF) of $2.56 Billion. Analysts expect this figure to grow steadily, projecting it will reach $3.46 Billion by the end of 2027. Looking further ahead, estimates, combining analyst forecasts and extrapolations, put its FCF at over $5.1 Billion by 2035. These growth expectations form the backbone of the DCF analysis, utilizing a 2 Stage Free Cash Flow to Equity model to arrive at a fair value for the company.
This model’s outcome gives Constellation Software an intrinsic value of $5,213 per share. Compared with the current share price, this suggests the stock is trading at a 35% discount, pointing to a significant undervaluation based on projected cash flows alone.
Result: UNDERVALUED
Our Discounted Cash Flow (DCF) analysis suggests Constellation Software is undervalued by 35.0%. Track this in your watchlist or portfolio, or discover 878 more undervalued stocks based on cash flows.

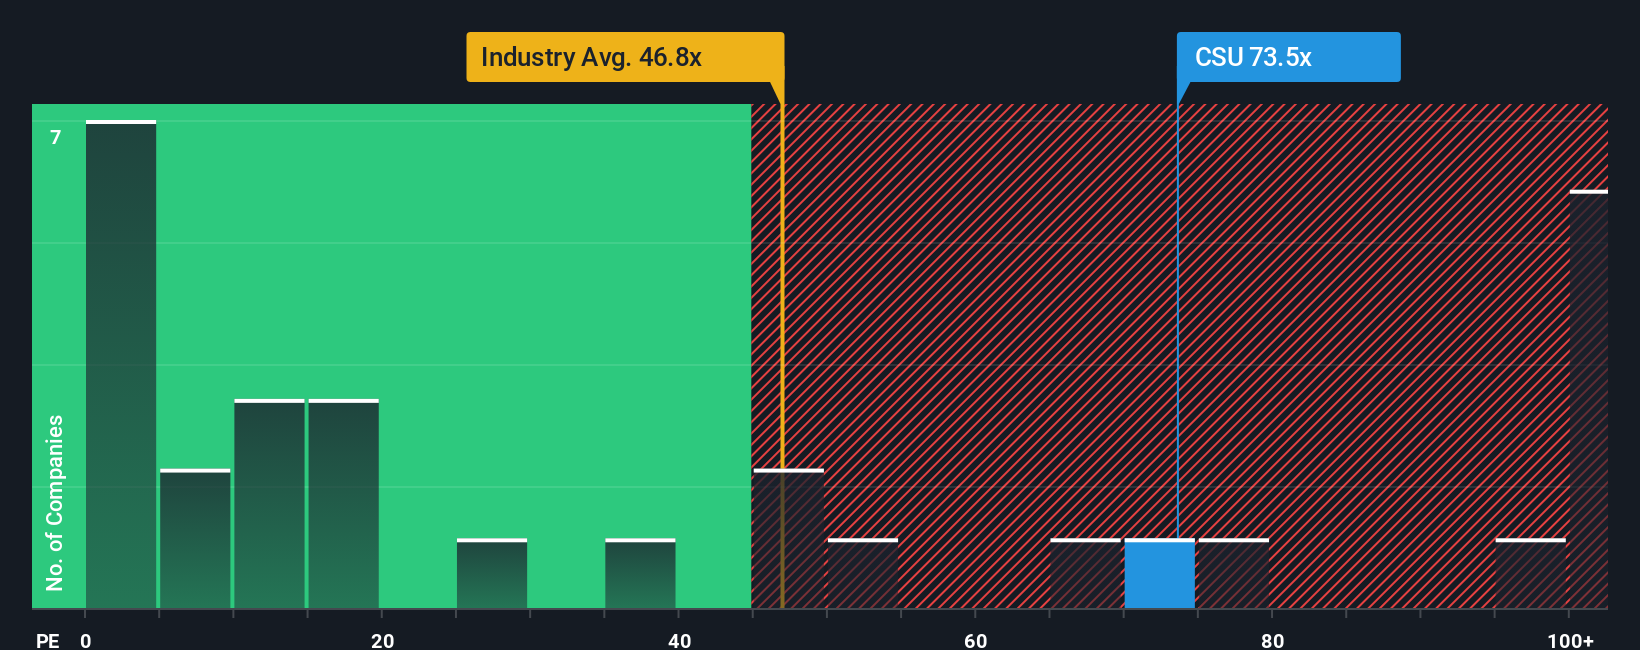
Approach 2: Constellation Software Price vs Earnings (PE)
The Price-to-Earnings (PE) ratio is a widely used valuation metric for profitable companies like Constellation Software because it directly links a company's share price to its bottom-line earnings. It helps investors quickly compare how the market values a company's profits relative to its peers and the broader industry.
Growth expectations and risk play major roles in determining what counts as a "normal" or "fair" PE ratio. Companies with higher growth prospects or lower risk profiles generally command higher multiples, while those facing more uncertainty or slower expansion might trade at a discount.
Currently, Constellation Software trades at a PE ratio of 74.44x. This is higher than the Software industry average of 54.03x and above the average among peers at 58.71x. However, Simply Wall St uses a proprietary "Fair Ratio" model to set a more tailored benchmark for Constellation Software. In this case, the Fair Ratio is 42.48x, taking into account its unique attributes such as earnings growth, profit margins, market capitalization, and risk profile.
The Fair Ratio offers a more focused comparison than industry averages or peer group metrics, since it adjusts for factors specific to Constellation’s financial performance and risk. This means that while the company’s actual multiple is well above generic benchmarks, it also significantly exceeds its own Fair Ratio, which considers its true underlying growth and risk dynamics.
With a PE ratio of 74.44x compared to a Fair Ratio of 42.48x, the stock appears overvalued using this approach.
Result: OVERVALUED
PE ratios tell one story, but what if the real opportunity lies elsewhere? Discover 1403 companies where insiders are betting big on explosive growth.
Upgrade Your Decision Making: Choose your Constellation Software Narrative
Earlier we mentioned that there is an even better way to understand valuation, so let's introduce you to Narratives. A Narrative is a simple, accessible way for investors to create and share their own story behind a company by combining their views on future revenue, profit margins, and risks into a clear financial forecast that leads to a fair value estimate. Narratives connect the dots between what is happening in Constellation Software’s business, what you believe about its future, and what you think the shares are worth right now.
Available on Simply Wall St's Community page, these Narratives are used by millions of investors to clarify when to buy or sell by comparing their own Fair Value with the current market price. What makes Narratives powerful is that they update dynamically as new information emerges, such as earnings or industry news, ensuring your investment thesis stays relevant. For example, some investors currently estimate Constellation Software’s fair value well above the current price, while others see it much lower, reflecting their different views and projections.
With Narratives, you do not need to be a financial expert to weigh in, experiment with your forecasts, and join a smarter discussion about what Constellation Software is really worth.
Do you think there's more to the story for Constellation Software? Head over to our Community to see what others are saying!
This article by Simply Wall St is general in nature. We provide commentary based on historical data and analyst forecasts only using an unbiased methodology and our articles are not intended to be financial advice. It does not constitute a recommendation to buy or sell any stock, and does not take account of your objectives, or your financial situation. We aim to bring you long-term focused analysis driven by fundamental data. Note that our analysis may not factor in the latest price-sensitive company announcements or qualitative material. Simply Wall St has no position in any stocks mentioned.
New: AI Stock Screener & Alerts
Our new AI Stock Screener scans the market every day to uncover opportunities.
• Dividend Powerhouses (3%+ Yield)
• Undervalued Small Caps with Insider Buying
• High growth Tech and AI Companies
Or build your own from over 50 metrics.
Have feedback on this article? Concerned about the content? Get in touch with us directly. Alternatively, email editorial-team@simplywallst.com
About TSX:CSU
Constellation Software
Acquires, builds, and manages vertical market software businesses to develop mission-critical software solutions for public and private sector markets.
Reasonable growth potential with adequate balance sheet.
Similar Companies
Market Insights

Advertisement
Community Narratives
The "Molecular Pencil": Why Beam's Technology is Built to Win
Fair Value US$65.01|65.4% undervalued
DA
Community Contributor
The silent giant behind virtually every advanced chip powering AI, smartphones, and modern infrastructure.
Fair Value US$310.00|6.1% undervalued
OS
Community Contributor
ADP Stock: Solid Fundamentals, But AI Investments Test Its Margin Resilience
Fair Value US$387.77|34.2% undervalued
YI
Community Contributor
MINISO's fair value is projected at 26.69 with an anticipated PE ratio shift of 20x
Fair Value US$24.03|9.6% undervalued
BE
Community Contributor