Advertisement
- Canada
- /
- Retail REITs
- /
- TSX:CRR.UN
Crombie REIT (TSX:CRR.UN): Evaluating Valuation After Record Q3 Results and Increased Distributions

Simply Wall St
Reviewed by Simply Wall St
Crombie Real Estate Investment Trust (TSX:CRR.UN) just released third quarter results that should catch investors’ attention. Sales, net income, and portfolio occupancy all improved. In addition, management announced a bump in annual distributions.
See our latest analysis for Crombie Real Estate Investment Trust.
Crombie’s recent uptick in share price, now at $15.14, comes as investors digest the company’s record occupancy and boosted distributions. Momentum has been gradually building this year, with a robust 13.7% year-to-date share price return and a standout 9.5% total shareholder return over the past twelve months, which underscores renewed confidence in Crombie’s growth prospects. Longer-term holders have also been rewarded, as the five-year total shareholder return now sits at an impressive 40%.
If Crombie’s solid momentum has you thinking about what else is gaining ground, it could be a great time to broaden your horizons and discover fast growing stocks with high insider ownership
With the latest earnings and a rising share price, some investors may wonder if Crombie Real Estate Investment Trust is trading below its true value or if the market has already baked in the future growth story. Could there still be a buying opportunity?
Price-to-Earnings of 16.8x: Is it justified?
Crombie Real Estate Investment Trust is currently trading at a price-to-earnings (P/E) ratio of 16.8x, while its share price sits at CA$15.14. Compared to its direct peers, the stock looks slightly expensive on this metric.
The P/E ratio measures how much investors are willing to pay per dollar of earnings, often reflecting expectations for future growth, profitability, and relative value in the sector. For a REIT like Crombie, investors look for a combination of stable earnings, reliable dividends, and asset appreciation.
While a higher P/E could indicate that the market expects stronger future profit growth, in Crombie’s case, the figure is above the peer group average of 15.9x. This suggests a market premium. However, when benchmarked against the broader North American Retail REITs industry average of 24.7x, Crombie actually trades at a significant discount to the larger sector.
See what the numbers say about this price — find out in our valuation breakdown.
Result: Price-to-Earnings of 16.8x (OVERVALUED)
However, slower revenue growth and ongoing market volatility could challenge Crombie’s upbeat momentum. This makes ongoing performance worth monitoring in the months ahead.
Find out about the key risks to this Crombie Real Estate Investment Trust narrative.
Another View: Discounted Cash Flow Model Offers a Different Take
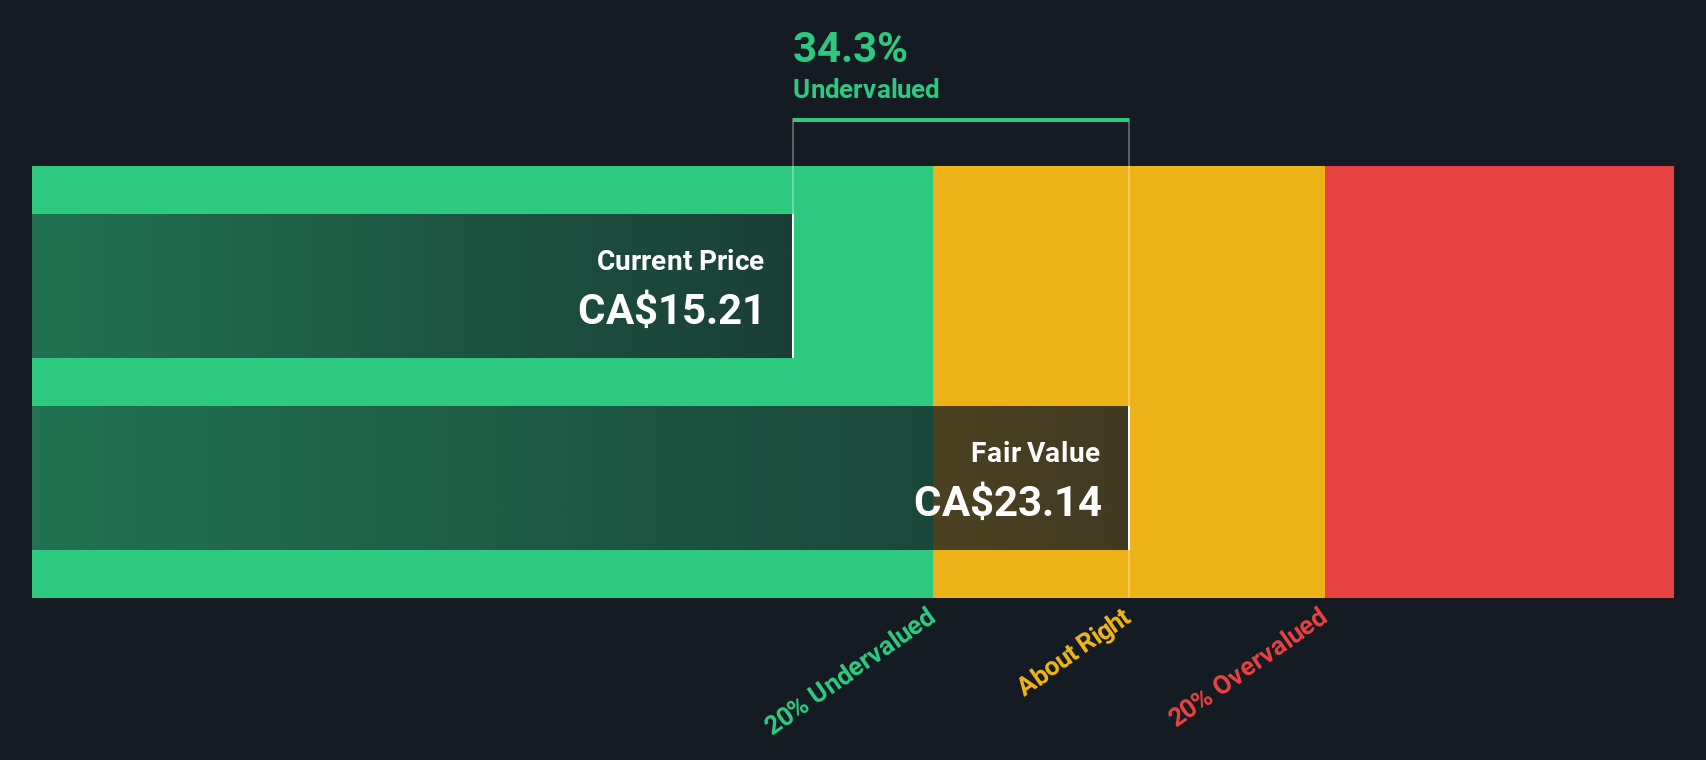
While Crombie’s current valuation looks steep against its peers, the SWS DCF model suggests a dramatically different story. According to this approach, Crombie's shares are trading about 40% below their estimated fair value. This points to possible undervaluation rather than overheating. Could this gap signal higher upside potential, or does it highlight risk not captured by the multiples?
Look into how the SWS DCF model arrives at its fair value.
Simply Wall St performs a discounted cash flow (DCF) on every stock in the world every day (check out Crombie Real Estate Investment Trust for example). We show the entire calculation in full. You can track the result in your watchlist or portfolio and be alerted when this changes, or use our stock screener to discover 876 undervalued stocks based on their cash flows. If you save a screener we even alert you when new companies match - so you never miss a potential opportunity.
Build Your Own Crombie Real Estate Investment Trust Narrative
If you prefer to dive into the numbers yourself or want to form your own perspective, you can easily craft a personalized view in just minutes, so Do it your way.
A great starting point for your Crombie Real Estate Investment Trust research is our analysis highlighting 3 key rewards and 2 important warning signs that could impact your investment decision.
Looking for More Investment Ideas?
Don’t let fresh opportunities pass you by. The right screener can open doors to smart, timely investments perfectly suited to your strategy.
- Start building your portfolio’s momentum with stable income from these 16 dividend stocks with yields > 3% yielding over 3% and backed by robust fundamentals.
- Spot tomorrow’s breakthroughs by targeting innovation leaders among these 25 AI penny stocks as they change entire industries with artificial intelligence.
- Boost your potential returns by tracking value opportunities in these 876 undervalued stocks based on cash flows currently priced below what their cash flows suggest they’re worth.
This article by Simply Wall St is general in nature. We provide commentary based on historical data and analyst forecasts only using an unbiased methodology and our articles are not intended to be financial advice. It does not constitute a recommendation to buy or sell any stock, and does not take account of your objectives, or your financial situation. We aim to bring you long-term focused analysis driven by fundamental data. Note that our analysis may not factor in the latest price-sensitive company announcements or qualitative material. Simply Wall St has no position in any stocks mentioned.
New: AI Stock Screener & Alerts
Our new AI Stock Screener scans the market every day to uncover opportunities.
• Dividend Powerhouses (3%+ Yield)
• Undervalued Small Caps with Insider Buying
• High growth Tech and AI Companies
Or build your own from over 50 metrics.
Have feedback on this article? Concerned about the content? Get in touch with us directly. Alternatively, email editorial-team@simplywallst.com
About TSX:CRR.UN
Crombie Real Estate Investment Trust
Crombie invests in real estate with a vision of enriching communities together by building spaces and value today that leave a positive impact on tomorrow.
6 star dividend payer with proven track record.
Market Insights

Advertisement
Community Narratives
The company that turned a verb into a global necessity and basically runs the modern internet, digital ads, smartphones, maps, and AI.
Fair Value US$300.00|7.1% undervalued
OS
Community Contributor
Flowers Foods Pays A Fair Price For Health
Fair Value US$16.12|26.4% undervalued
NV
Community Contributor
TMX Group will thrive with 33.3% profit margin and enduring market moat
Fair Value CA$49.90|0.8% overvalued
LI
Community Contributor
The "Molecular Pencil": Why Beam's Technology is Built to Win
Fair Value US$65.01|65.8% undervalued
DA
Community Contributor