- Canada
- /
- Real Estate
- /
- TSX:DRM
The 25% return this week takes Dream Unlimited's (TSE:DRM) shareholders five-year gains to 68%


Generally speaking the aim of active stock picking is to find companies that provide returns that are superior to the market average. And the truth is, you can make significant gains if you buy good quality businesses at the right price. For example, long term Dream Unlimited Corp. (TSE:DRM) shareholders have enjoyed a 53% share price rise over the last half decade, well in excess of the market return of around 39% (not including dividends). However, more recent returns haven't been as impressive as that, with the stock returning just 33% in the last year, including dividends.
The past week has proven to be lucrative for Dream Unlimited investors, so let's see if fundamentals drove the company's five-year performance.
View our latest analysis for Dream Unlimited
Dream Unlimited isn't currently profitable, so most analysts would look to revenue growth to get an idea of how fast the underlying business is growing. Generally speaking, companies without profits are expected to grow revenue every year, and at a good clip. That's because it's hard to be confident a company will be sustainable if revenue growth is negligible, and it never makes a profit.
Over the last half decade Dream Unlimited's revenue has actually been trending down at about 5.2% per year. Even though revenue hasn't increased, the stock actually gained 9%, per year, during the same period. To us that suggests that there probably isn't a lot of correlation between the past revenue performance and the share price, but a closer look at analyst forecasts and the bottom line may well explain a lot.
The company's revenue and earnings (over time) are depicted in the image below (click to see the exact numbers).
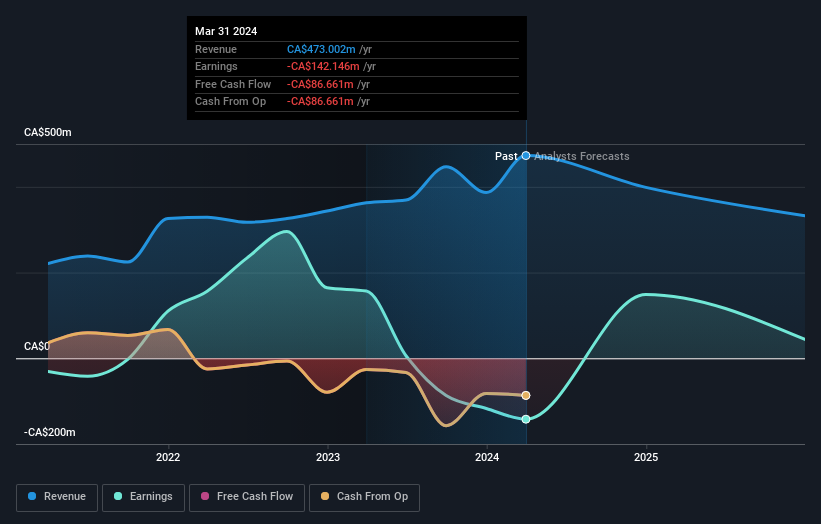
You can see how its balance sheet has strengthened (or weakened) over time in this free interactive graphic.
What About Dividends?
When looking at investment returns, it is important to consider the difference between total shareholder return (TSR) and share price return. Whereas the share price return only reflects the change in the share price, the TSR includes the value of dividends (assuming they were reinvested) and the benefit of any discounted capital raising or spin-off. It's fair to say that the TSR gives a more complete picture for stocks that pay a dividend. We note that for Dream Unlimited the TSR over the last 5 years was 68%, which is better than the share price return mentioned above. The dividends paid by the company have thusly boosted the total shareholder return.
A Different Perspective
We're pleased to report that Dream Unlimited shareholders have received a total shareholder return of 33% over one year. And that does include the dividend. Since the one-year TSR is better than the five-year TSR (the latter coming in at 11% per year), it would seem that the stock's performance has improved in recent times. Given the share price momentum remains strong, it might be worth taking a closer look at the stock, lest you miss an opportunity. It's always interesting to track share price performance over the longer term. But to understand Dream Unlimited better, we need to consider many other factors. Consider risks, for instance. Every company has them, and we've spotted 2 warning signs for Dream Unlimited you should know about.
If you are like me, then you will not want to miss this free list of undervalued small caps that insiders are buying.
Please note, the market returns quoted in this article reflect the market weighted average returns of stocks that currently trade on Canadian exchanges.
New: Manage All Your Stock Portfolios in One Place
We've created the ultimate portfolio companion for stock investors, and it's free.
• Connect an unlimited number of Portfolios and see your total in one currency
• Be alerted to new Warning Signs or Risks via email or mobile
• Track the Fair Value of your stocks
Have feedback on this article? Concerned about the content? Get in touch with us directly. Alternatively, email editorial-team (at) simplywallst.com.
This article by Simply Wall St is general in nature. We provide commentary based on historical data and analyst forecasts only using an unbiased methodology and our articles are not intended to be financial advice. It does not constitute a recommendation to buy or sell any stock, and does not take account of your objectives, or your financial situation. We aim to bring you long-term focused analysis driven by fundamental data. Note that our analysis may not factor in the latest price-sensitive company announcements or qualitative material. Simply Wall St has no position in any stocks mentioned.
About TSX:DRM
Dream Unlimited
Dream Unlimited Corp. formerly known as Dundee Realty Corporation is a real estate investment firm.
Good value low.

