
Advertisement
Market Might Still Lack Some Conviction On Simply Better Brands Corp. (CVE:SBBC) Even After 43% Share Price Boost
Simply Better Brands Corp. (CVE:SBBC) shares have had a really impressive month, gaining 43% after a shaky period beforehand. Looking further back, the 22% rise over the last twelve months isn't too bad notwithstanding the strength over the last 30 days.
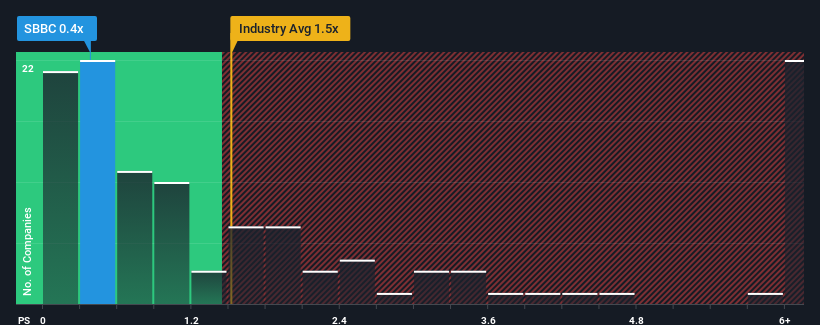
Although its price has surged higher, Simply Better Brands may still be sending bullish signals at the moment with its price-to-sales (or "P/S") ratio of 0.4x, since almost half of all companies in the Pharmaceuticals industry in Canada have P/S ratios greater than 1.5x and even P/S higher than 4x are not unusual. Although, it's not wise to just take the P/S at face value as there may be an explanation why it's limited.
Check out our latest analysis for Simply Better Brands
How Simply Better Brands Has Been Performing
The recent revenue growth at Simply Better Brands would have to be considered satisfactory if not spectacular. It might be that many expect the respectable revenue performance to degrade, which has repressed the P/S. If that doesn't eventuate, then existing shareholders may have reason to be optimistic about the future direction of the share price.
Although there are no analyst estimates available for Simply Better Brands, take a look at this free data-rich visualisation to see how the company stacks up on earnings, revenue and cash flow.Is There Any Revenue Growth Forecasted For Simply Better Brands?
Simply Better Brands' P/S ratio would be typical for a company that's only expected to deliver limited growth, and importantly, perform worse than the industry.
If we review the last year of revenue growth, the company posted a worthy increase of 5.1%. While this performance is only fair, the company was still able to deliver immense revenue growth over the last three years. So we can start by confirming that the company has done a tremendous job of growing revenue over that time.
Comparing that recent medium-term revenue trajectory with the industry's one-year growth forecast of 5.2% shows it's noticeably more attractive.
With this in mind, we find it intriguing that Simply Better Brands' P/S isn't as high compared to that of its industry peers. Apparently some shareholders believe the recent performance has exceeded its limits and have been accepting significantly lower selling prices.
The Final Word
Simply Better Brands' stock price has surged recently, but its but its P/S still remains modest. While the price-to-sales ratio shouldn't be the defining factor in whether you buy a stock or not, it's quite a capable barometer of revenue expectations.
We're very surprised to see Simply Better Brands currently trading on a much lower than expected P/S since its recent three-year growth is higher than the wider industry forecast. When we see strong revenue with faster-than-industry growth, we assume there are some significant underlying risks to the company's ability to make money which is applying downwards pressure on the P/S ratio. It appears many are indeed anticipating revenue instability, because the persistence of these recent medium-term conditions would normally provide a boost to the share price.
We don't want to rain on the parade too much, but we did also find 4 warning signs for Simply Better Brands (2 are concerning!) that you need to be mindful of.
Of course, profitable companies with a history of great earnings growth are generally safer bets. So you may wish to see this free collection of other companies that have reasonable P/E ratios and have grown earnings strongly.
Valuation is complex, but we're here to simplify it.
Discover if TRUBAR might be undervalued or overvalued with our detailed analysis, featuring fair value estimates, potential risks, dividends, insider trades, and its financial condition.
Access Free AnalysisHave feedback on this article? Concerned about the content? Get in touch with us directly. Alternatively, email editorial-team (at) simplywallst.com.
This article by Simply Wall St is general in nature. We provide commentary based on historical data and analyst forecasts only using an unbiased methodology and our articles are not intended to be financial advice. It does not constitute a recommendation to buy or sell any stock, and does not take account of your objectives, or your financial situation. We aim to bring you long-term focused analysis driven by fundamental data. Note that our analysis may not factor in the latest price-sensitive company announcements or qualitative material. Simply Wall St has no position in any stocks mentioned.
About TSXV:TRBR
TRUBAR
Operates as a consumer products company with diversified assets in the plant-based and wellness consumer product categories in Canada.
Low risk with limited growth.
Similar Companies
Market Insights

Advertisement
Community Narratives
The company that turned a verb into a global necessity and basically runs the modern internet, digital ads, smartphones, maps, and AI.
Fair Value US$300.00|7.5% undervalued
OS
Community Contributor
Flowers Foods Pays A Fair Price For Health
Fair Value US$16.12|25.4% undervalued
NV
Community Contributor
TMX Group will thrive with 33.3% profit margin and enduring market moat
Fair Value CA$49.90|3.6% overvalued
LI
Community Contributor
The "Molecular Pencil": Why Beam's Technology is Built to Win
Fair Value US$65.01|65.0% undervalued
DA
Community Contributor