
Advertisement
Further Upside For Simply Better Brands Corp. (CVE:SBBC) Shares Could Introduce Price Risks After 27% Bounce
Simply Better Brands Corp. (CVE:SBBC) shares have continued their recent momentum with a 27% gain in the last month alone. Still, the 30-day jump doesn't change the fact that longer term shareholders have seen their stock decimated by the 89% share price drop in the last twelve months.
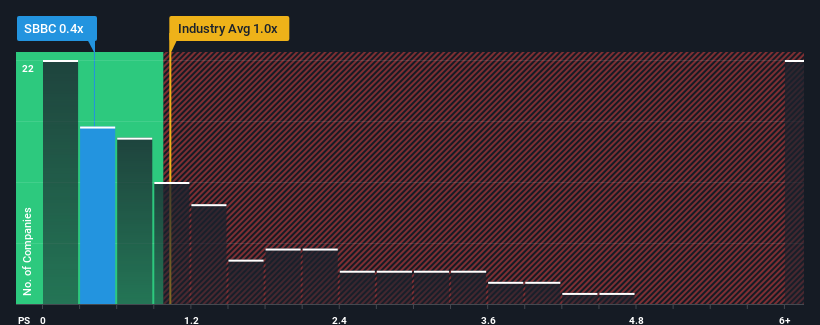
Even after such a large jump in price, it would still be understandable if you think Simply Better Brands is a stock with good investment prospects with a price-to-sales ratios (or "P/S") of 0.4x, considering almost half the companies in Canada's Pharmaceuticals industry have P/S ratios above 1x. Nonetheless, we'd need to dig a little deeper to determine if there is a rational basis for the reduced P/S.
See our latest analysis for Simply Better Brands
What Does Simply Better Brands' Recent Performance Look Like?
With revenue growth that's exceedingly strong of late, Simply Better Brands has been doing very well. It might be that many expect the strong revenue performance to degrade substantially, which has repressed the P/S ratio. Those who are bullish on Simply Better Brands will be hoping that this isn't the case, so that they can pick up the stock at a lower valuation.
Want the full picture on earnings, revenue and cash flow for the company? Then our free report on Simply Better Brands will help you shine a light on its historical performance.Is There Any Revenue Growth Forecasted For Simply Better Brands?
There's an inherent assumption that a company should underperform the industry for P/S ratios like Simply Better Brands' to be considered reasonable.
Taking a look back first, we see that the company's revenues underwent some rampant growth over the last 12 months. The amazing performance means it was also able to grow revenue by 93% in total over the last three years. So we can start by confirming that the company has done a great job of growing revenue over that time.
Comparing that to the industry, which is only predicted to deliver 11% growth in the next 12 months, the company's momentum is stronger based on recent medium-term annualised revenue results.
In light of this, it's peculiar that Simply Better Brands' P/S sits below the majority of other companies. Apparently some shareholders believe the recent performance has exceeded its limits and have been accepting significantly lower selling prices.
What We Can Learn From Simply Better Brands' P/S?
Despite Simply Better Brands' share price climbing recently, its P/S still lags most other companies. It's argued the price-to-sales ratio is an inferior measure of value within certain industries, but it can be a powerful business sentiment indicator.
Our examination of Simply Better Brands revealed its three-year revenue trends aren't boosting its P/S anywhere near as much as we would have predicted, given they look better than current industry expectations. When we see strong revenue with faster-than-industry growth, we assume there are some significant underlying risks to the company's ability to make money which is applying downwards pressure on the P/S ratio. At least price risks look to be very low if recent medium-term revenue trends continue, but investors seem to think future revenue could see a lot of volatility.
Before you settle on your opinion, we've discovered 5 warning signs for Simply Better Brands (3 shouldn't be ignored!) that you should be aware of.
If companies with solid past earnings growth is up your alley, you may wish to see this free collection of other companies with strong earnings growth and low P/E ratios.
Valuation is complex, but we're here to simplify it.
Discover if TRUBAR might be undervalued or overvalued with our detailed analysis, featuring fair value estimates, potential risks, dividends, insider trades, and its financial condition.
Access Free AnalysisHave feedback on this article? Concerned about the content? Get in touch with us directly. Alternatively, email editorial-team (at) simplywallst.com.
This article by Simply Wall St is general in nature. We provide commentary based on historical data and analyst forecasts only using an unbiased methodology and our articles are not intended to be financial advice. It does not constitute a recommendation to buy or sell any stock, and does not take account of your objectives, or your financial situation. We aim to bring you long-term focused analysis driven by fundamental data. Note that our analysis may not factor in the latest price-sensitive company announcements or qualitative material. Simply Wall St has no position in any stocks mentioned.
About TSXV:TRBR
TRUBAR
Operates as a consumer products company with diversified assets in the plant-based and wellness consumer product categories in Canada.
Low risk with limited growth.
Similar Companies
Market Insights

Advertisement
Community Narratives
The company that turned a verb into a global necessity and basically runs the modern internet, digital ads, smartphones, maps, and AI.
Fair Value US$300.00|5.2% undervalued
OS
Community Contributor
Flowers Foods Pays A Fair Price For Health
Fair Value US$16.12|24.9% undervalued
NV
Community Contributor
TMX Group will thrive with 33.3% profit margin and enduring market moat
Fair Value CA$49.90|3.3% overvalued
LI
Community Contributor
The "Molecular Pencil": Why Beam's Technology is Built to Win
Fair Value US$65.01|64.5% undervalued
DA
Community Contributor