
Advertisement
iAnthus Capital Holdings, Inc. (CSE:IAN) Stocks Pounded By 29% But Not Lagging Industry On Growth Or Pricing
Unfortunately for some shareholders, the iAnthus Capital Holdings, Inc. (CSE:IAN) share price has dived 29% in the last thirty days, prolonging recent pain. The drop over the last 30 days has capped off a tough year for shareholders, with the share price down 17% in that time.
In spite of the heavy fall in price, there still wouldn't be many who think iAnthus Capital Holdings' price-to-sales (or "P/S") ratio of 0.8x is worth a mention when the median P/S in Canada's Pharmaceuticals industry is similar at about 1.2x. While this might not raise any eyebrows, if the P/S ratio is not justified investors could be missing out on a potential opportunity or ignoring looming disappointment.
View our latest analysis for iAnthus Capital Holdings
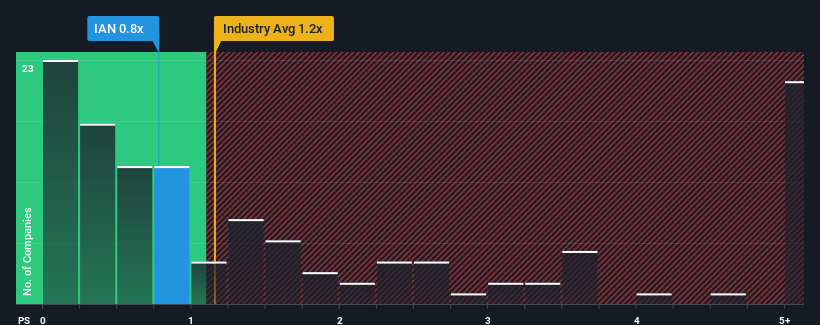
What Does iAnthus Capital Holdings' P/S Mean For Shareholders?
For example, consider that iAnthus Capital Holdings' financial performance has been poor lately as its revenue has been in decline. One possibility is that the P/S is moderate because investors think the company might still do enough to be in line with the broader industry in the near future. If you like the company, you'd at least be hoping this is the case so that you could potentially pick up some stock while it's not quite in favour.
Although there are no analyst estimates available for iAnthus Capital Holdings, take a look at this free data-rich visualisation to see how the company stacks up on earnings, revenue and cash flow.Do Revenue Forecasts Match The P/S Ratio?
There's an inherent assumption that a company should be matching the industry for P/S ratios like iAnthus Capital Holdings' to be considered reasonable.
In reviewing the last year of financials, we were disheartened to see the company's revenues fell to the tune of 9.8%. Regardless, revenue has managed to lift by a handy 17% in aggregate from three years ago, thanks to the earlier period of growth. So we can start by confirming that the company has generally done a good job of growing revenue over that time, even though it had some hiccups along the way.
Comparing that to the industry, which is predicted to deliver 4.2% growth in the next 12 months, the company's momentum is pretty similar based on recent medium-term annualised revenue results.
With this information, we can see why iAnthus Capital Holdings is trading at a fairly similar P/S to the industry. It seems most investors are expecting to see average growth rates continue into the future and are only willing to pay a moderate amount for the stock.
The Key Takeaway
iAnthus Capital Holdings' plummeting stock price has brought its P/S back to a similar region as the rest of the industry. Using the price-to-sales ratio alone to determine if you should sell your stock isn't sensible, however it can be a practical guide to the company's future prospects.
It appears to us that iAnthus Capital Holdings maintains its moderate P/S off the back of its recent three-year growth being in line with the wider industry forecast. Right now shareholders are comfortable with the P/S as they are quite confident future revenue won't throw up any surprises. If recent medium-term revenue trends continue, it's hard to see the share price moving strongly in either direction in the near future under these circumstances.
We don't want to rain on the parade too much, but we did also find 4 warning signs for iAnthus Capital Holdings (3 are concerning!) that you need to be mindful of.
It's important to make sure you look for a great company, not just the first idea you come across. So if growing profitability aligns with your idea of a great company, take a peek at this free list of interesting companies with strong recent earnings growth (and a low P/E).
Valuation is complex, but we're here to simplify it.
Discover if iAnthus Capital Holdings might be undervalued or overvalued with our detailed analysis, featuring fair value estimates, potential risks, dividends, insider trades, and its financial condition.
Access Free AnalysisHave feedback on this article? Concerned about the content? Get in touch with us directly. Alternatively, email editorial-team (at) simplywallst.com.
This article by Simply Wall St is general in nature. We provide commentary based on historical data and analyst forecasts only using an unbiased methodology and our articles are not intended to be financial advice. It does not constitute a recommendation to buy or sell any stock, and does not take account of your objectives, or your financial situation. We aim to bring you long-term focused analysis driven by fundamental data. Note that our analysis may not factor in the latest price-sensitive company announcements or qualitative material. Simply Wall St has no position in any stocks mentioned.
About CNSX:IAN
iAnthus Capital Holdings
Owns and operates licensed cannabis cultivation, processing, and dispensary facilities in the United States.
Moderate risk and good value.
Similar Companies
Market Insights

Advertisement
Community Narratives
The company that turned a verb into a global necessity and basically runs the modern internet, digital ads, smartphones, maps, and AI.
Fair Value US$300.00|7.5% undervalued
OS
Community Contributor
Flowers Foods Pays A Fair Price For Health
Fair Value US$16.12|25.4% undervalued
NV
Community Contributor
TMX Group will thrive with 33.3% profit margin and enduring market moat
Fair Value CA$49.90|3.6% overvalued
LI
Community Contributor
The "Molecular Pencil": Why Beam's Technology is Built to Win
Fair Value US$65.01|65.0% undervalued
DA
Community Contributor