
Advertisement
- Canada
- /
- Interactive Media and Services
- /
- TSX:ILLM
Risks Still Elevated At These Prices As illumin Holdings Inc. (TSE:ILLM) Shares Dive 31%
illumin Holdings Inc. (TSE:ILLM) shareholders won't be pleased to see that the share price has had a very rough month, dropping 31% and undoing the prior period's positive performance. The last month has meant the stock is now only up 3.4% during the last year.
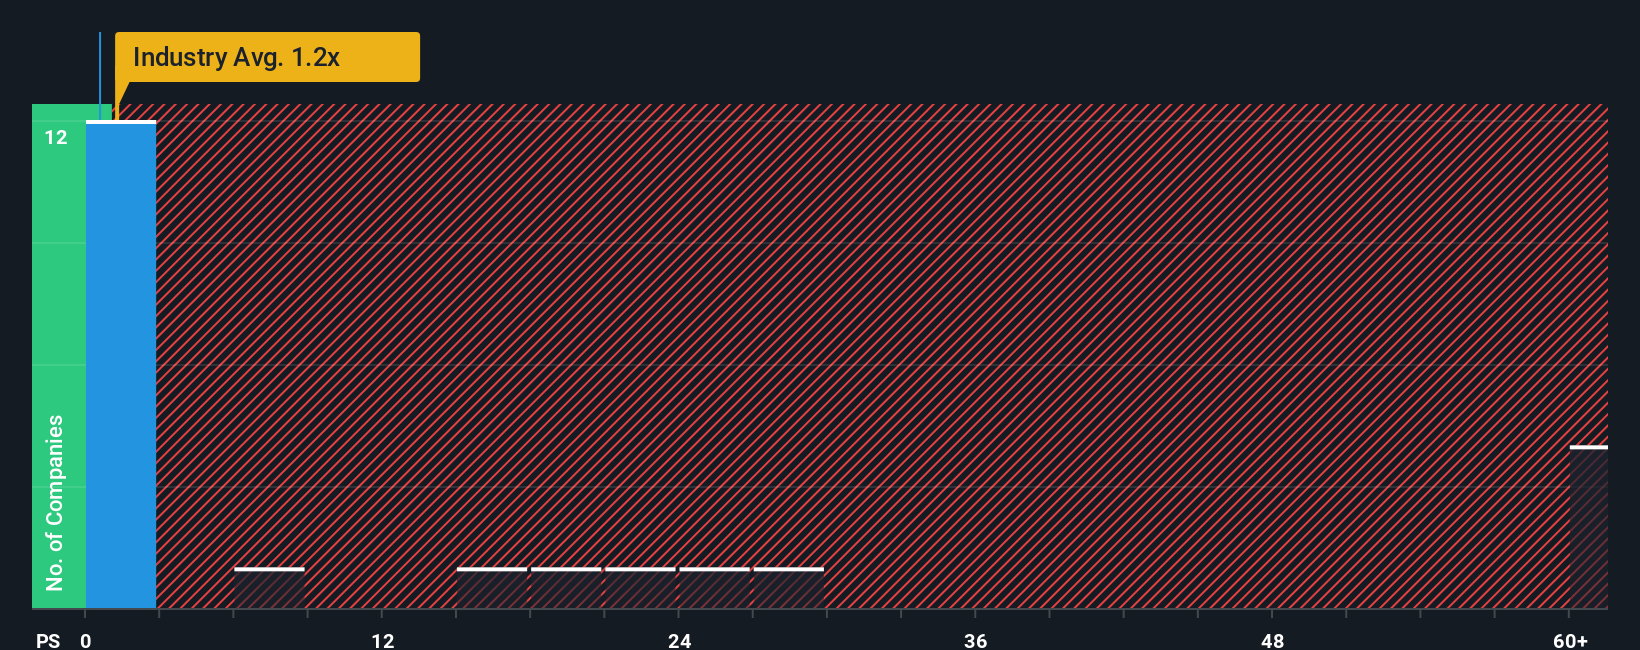
Although its price has dipped substantially, you could still be forgiven for feeling indifferent about illumin Holdings' P/S ratio of 0.5x, since the median price-to-sales (or "P/S") ratio for the Interactive Media and Services industry in Canada is also close to 0.7x. While this might not raise any eyebrows, if the P/S ratio is not justified investors could be missing out on a potential opportunity or ignoring looming disappointment.
Check out our latest analysis for illumin Holdings
What Does illumin Holdings' P/S Mean For Shareholders?
Recent times have been pleasing for illumin Holdings as its revenue has risen in spite of the industry's average revenue going into reverse. It might be that many expect the strong revenue performance to deteriorate like the rest, which has kept the P/S ratio from rising. Those who are bullish on illumin Holdings will be hoping that this isn't the case, so that they can pick up the stock at a slightly lower valuation.
Want the full picture on analyst estimates for the company? Then our free report on illumin Holdings will help you uncover what's on the horizon.How Is illumin Holdings' Revenue Growth Trending?
In order to justify its P/S ratio, illumin Holdings would need to produce growth that's similar to the industry.
If we review the last year of revenue growth, the company posted a terrific increase of 23%. The latest three year period has also seen a 28% overall rise in revenue, aided extensively by its short-term performance. Accordingly, shareholders would have probably been satisfied with the medium-term rates of revenue growth.
Turning to the outlook, the next year should generate growth of 6.3% as estimated by the four analysts watching the company. Meanwhile, the rest of the industry is forecast to expand by 15%, which is noticeably more attractive.
With this information, we find it interesting that illumin Holdings is trading at a fairly similar P/S compared to the industry. Apparently many investors in the company are less bearish than analysts indicate and aren't willing to let go of their stock right now. These shareholders may be setting themselves up for future disappointment if the P/S falls to levels more in line with the growth outlook.
The Key Takeaway
illumin Holdings' plummeting stock price has brought its P/S back to a similar region as the rest of the industry. It's argued the price-to-sales ratio is an inferior measure of value within certain industries, but it can be a powerful business sentiment indicator.
Our look at the analysts forecasts of illumin Holdings' revenue prospects has shown that its inferior revenue outlook isn't negatively impacting its P/S as much as we would have predicted. At present, we aren't confident in the P/S as the predicted future revenues aren't likely to support a more positive sentiment for long. A positive change is needed in order to justify the current price-to-sales ratio.
Before you take the next step, you should know about the 1 warning sign for illumin Holdings that we have uncovered.
If strong companies turning a profit tickle your fancy, then you'll want to check out this free list of interesting companies that trade on a low P/E (but have proven they can grow earnings).
Valuation is complex, but we're here to simplify it.
Discover if illumin Holdings might be undervalued or overvalued with our detailed analysis, featuring fair value estimates, potential risks, dividends, insider trades, and its financial condition.
Access Free AnalysisHave feedback on this article? Concerned about the content? Get in touch with us directly. Alternatively, email editorial-team (at) simplywallst.com.
This article by Simply Wall St is general in nature. We provide commentary based on historical data and analyst forecasts only using an unbiased methodology and our articles are not intended to be financial advice. It does not constitute a recommendation to buy or sell any stock, and does not take account of your objectives, or your financial situation. We aim to bring you long-term focused analysis driven by fundamental data. Note that our analysis may not factor in the latest price-sensitive company announcements or qualitative material. Simply Wall St has no position in any stocks mentioned.
About TSX:ILLM
illumin Holdings
A technology company, provides digital media solutions in the United States, Canada, Europe, Latin America, and internationally.
Excellent balance sheet and fair value.
Similar Companies
Market Insights

Advertisement
Community Narratives
The company that turned a verb into a global necessity and basically runs the modern internet, digital ads, smartphones, maps, and AI.
Fair Value US$300.00|7.5% undervalued
OS
Community Contributor
Flowers Foods Pays A Fair Price For Health
Fair Value US$16.12|25.4% undervalued
NV
Community Contributor
TMX Group will thrive with 33.3% profit margin and enduring market moat
Fair Value CA$49.90|3.6% overvalued
LI
Community Contributor
The "Molecular Pencil": Why Beam's Technology is Built to Win
Fair Value US$65.01|65.0% undervalued
DA
Community Contributor