
Advertisement
- Canada
- /
- Metals and Mining
- /
- TSXV:EMPR
Here's Why We're Watching Empress Royalty's (CVE:EMPR) Cash Burn Situation
There's no doubt that money can be made by owning shares of unprofitable businesses. For example, although Amazon.com made losses for many years after listing, if you had bought and held the shares since 1999, you would have made a fortune. But the harsh reality is that very many loss making companies burn through all their cash and go bankrupt.
So, the natural question for Empress Royalty (CVE:EMPR) shareholders is whether they should be concerned by its rate of cash burn. In this article, we define cash burn as its annual (negative) free cash flow, which is the amount of money a company spends each year to fund its growth. First, we'll determine its cash runway by comparing its cash burn with its cash reserves.
See our latest analysis for Empress Royalty
How Long Is Empress Royalty's Cash Runway?
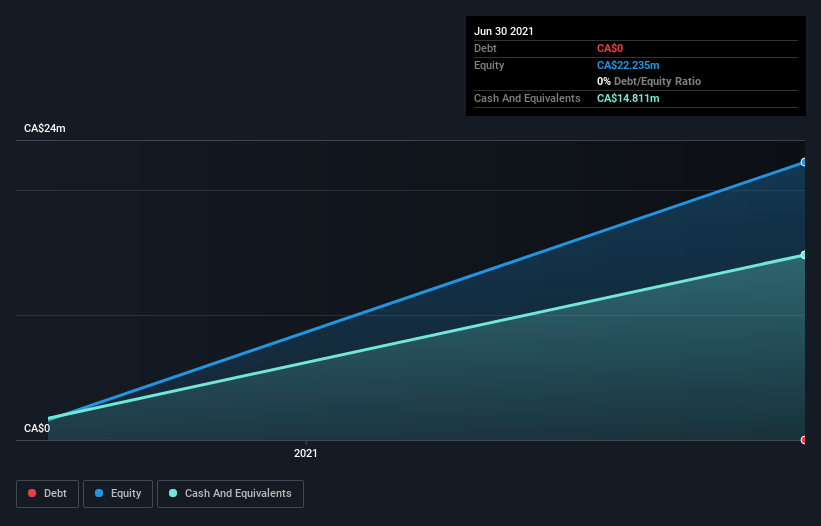
A company's cash runway is calculated by dividing its cash hoard by its cash burn. When Empress Royalty last reported its balance sheet in June 2021, it had zero debt and cash worth CA$15m. Importantly, its cash burn was CA$10m over the trailing twelve months. That means it had a cash runway of around 17 months as of June 2021. While that cash runway isn't too concerning, sensible holders would be peering into the distance, and considering what happens if the company runs out of cash. We should note, however, that if we extrapolate recent trends in its cash burn, then its cash runway would get a lot longer. Depicted below, you can see how its cash holdings have changed over time.
How Hard Would It Be For Empress Royalty To Raise More Cash For Growth?
Issuing new shares, or taking on debt, are the most common ways for a listed company to raise more money for its business. Many companies end up issuing new shares to fund future growth. We can compare a company's cash burn to its market capitalisation to get a sense for how many new shares a company would have to issue to fund one year's operations.
Empress Royalty has a market capitalisation of CA$32m and burnt through CA$10m last year, which is 32% of the company's market value. That's fairly notable cash burn, so if the company had to sell shares to cover the cost of another year's operations, shareholders would suffer some costly dilution.
Is Empress Royalty's Cash Burn A Worry?
Because Empress Royalty is an early stage company, we don't have a great deal of data on which to form an opinion of its cash burn. Certainly, we'd be more confident in the stock if it was generating operating revenue. And it is worth keeping in mind that early stage companies are generally more risky than well established ones. Even though we don't think shareholders should be alarmed by its cash burn, we do think they should be keeping a close eye on it. On another note, we conducted an in-depth investigation of the company, and identified 4 warning signs for Empress Royalty (1 doesn't sit too well with us!) that you should be aware of before investing here.
If you would prefer to check out another company with better fundamentals, then do not miss this free list of interesting companies, that have HIGH return on equity and low debt or this list of stocks which are all forecast to grow.
If you’re looking to trade a wide range of investments, open an account with the lowest-cost* platform trusted by professionals, Interactive Brokers. Their clients from over 200 countries and territories trade stocks, options, futures, forex, bonds and funds worldwide from a single integrated account. Promoted
Valuation is complex, but we're here to simplify it.
Discover if Empress Royalty might be undervalued or overvalued with our detailed analysis, featuring fair value estimates, potential risks, dividends, insider trades, and its financial condition.
Access Free AnalysisThis article by Simply Wall St is general in nature. We provide commentary based on historical data and analyst forecasts only using an unbiased methodology and our articles are not intended to be financial advice. It does not constitute a recommendation to buy or sell any stock, and does not take account of your objectives, or your financial situation. We aim to bring you long-term focused analysis driven by fundamental data. Note that our analysis may not factor in the latest price-sensitive company announcements or qualitative material. Simply Wall St has no position in any stocks mentioned.
*Interactive Brokers Rated Lowest Cost Broker by StockBrokers.com Annual Online Review 2020
Have feedback on this article? Concerned about the content? Get in touch with us directly. Alternatively, email editorial-team (at) simplywallst.com.
About TSXV:EMPR
Empress Royalty
Engages in creating and investing in a portfolio of precious metal royalty and streaming interests in Canada.
Excellent balance sheet with acceptable track record.
Market Insights

Advertisement
Community Narratives
MicroVision will explode future revenue by 380.37% with a vision towards success
Fair Value US$60|98.4% undervalued
TH
Community Contributor
The Indispensable Artery for a New North American Economy
Fair Value CA$132.87|0.6% undervalued
TI
Community Contributor
Recently Updated Narratives
BE


Bejgal on MINISO Group Holding ·
MINISO's fair value is projected at 26.69 with an anticipated PE ratio shift of 20x
Fair Value:US$26.6926.7% undervalued
44 followersusers have followed this narrative
3 commentsusers have commented on this narrative
0 likesusers have liked this narrative
TI


TickerTickle on Oracle ·
The Quiet Giant That Became AI’s Power Grid
Fair Value:US$389.8147.4% undervalued
7 followersusers have followed this narrative
1 commentusers have commented on this narrative
0 likesusers have liked this narrative
AU

AuCA on Nova Ljubljanska Banka d.d ·
Nova Ljubljanska Banka d.d will expect a 11.2% revenue boost driving future growth
Fair Value:€20916.5% undervalued
23 followersusers have followed this narrative
3 commentsusers have commented on this narrative
0 likesusers have liked this narrative
Popular Narratives
OS


oscargarcia on Alphabet ·
The company that turned a verb into a global necessity and basically runs the modern internet, digital ads, smartphones, maps, and AI.
Fair Value:US$3405.9% undervalued
136 followersusers have followed this narrative
6 commentsusers have commented on this narrative
18 likesusers have liked this narrative
TH

TheWallstreetKing on MicroVision ·
MicroVision will explode future revenue by 380.37% with a vision towards success
Fair Value:US$6098.4% undervalued
88 followersusers have followed this narrative
11 commentsusers have commented on this narrative
18 likesusers have liked this narrative
AN


AnalystConsensusTarget on NVIDIA ·
NVDA: Expanding AI Demand Will Drive Major Data Center Investments Through 2026
Fair Value:US$232.7922.6% undervalued
926 followersusers have followed this narrative
6 commentsusers have commented on this narrative
22 likesusers have liked this narrative