- Canada
- /
- Metals and Mining
- /
- TSX:TECK.B
There Are Reasons To Feel Uneasy About Teck Resources' (TSE:TECK.B) Returns On Capital


If we want to find a potential multi-bagger, often there are underlying trends that can provide clues. Firstly, we'd want to identify a growing return on capital employed (ROCE) and then alongside that, an ever-increasing base of capital employed. Put simply, these types of businesses are compounding machines, meaning they are continually reinvesting their earnings at ever-higher rates of return. Having said that, from a first glance at Teck Resources (TSE:TECK.B) we aren't jumping out of our chairs at how returns are trending, but let's have a deeper look.
Understanding Return On Capital Employed (ROCE)
Just to clarify if you're unsure, ROCE is a metric for evaluating how much pre-tax income (in percentage terms) a company earns on the capital invested in its business. To calculate this metric for Teck Resources, this is the formula:
Return on Capital Employed = Earnings Before Interest and Tax (EBIT) ÷ (Total Assets - Current Liabilities)
0.07 = CA$3.4b ÷ (CA$55b - CA$5.6b) (Based on the trailing twelve months to September 2023).
So, Teck Resources has an ROCE of 7.0%. In absolute terms, that's a low return, but it's much better than the Metals and Mining industry average of 2.9%.
Check out our latest analysis for Teck Resources
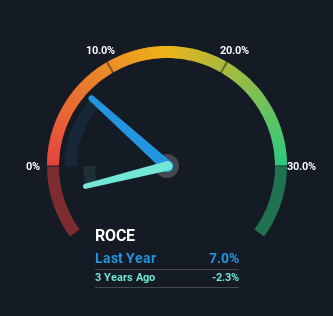
Above you can see how the current ROCE for Teck Resources compares to its prior returns on capital, but there's only so much you can tell from the past. If you're interested, you can view the analysts predictions in our free report on analyst forecasts for the company.
What The Trend Of ROCE Can Tell Us
On the surface, the trend of ROCE at Teck Resources doesn't inspire confidence. Around five years ago the returns on capital were 12%, but since then they've fallen to 7.0%. Given the business is employing more capital while revenue has slipped, this is a bit concerning. If this were to continue, you might be looking at a company that is trying to reinvest for growth but is actually losing market share since sales haven't increased.
In Conclusion...
From the above analysis, we find it rather worrisome that returns on capital and sales for Teck Resources have fallen, meanwhile the business is employing more capital than it was five years ago. Yet despite these poor fundamentals, the stock has gained a huge 111% over the last five years, so investors appear very optimistic. In any case, the current underlying trends don't bode well for long term performance so unless they reverse, we'd start looking elsewhere.
Teck Resources does have some risks, we noticed 2 warning signs (and 1 which shouldn't be ignored) we think you should know about.
For those who like to invest in solid companies, check out this free list of companies with solid balance sheets and high returns on equity.
Valuation is complex, but we're here to simplify it.
Discover if Teck Resources might be undervalued or overvalued with our detailed analysis, featuring fair value estimates, potential risks, dividends, insider trades, and its financial condition.
Access Free AnalysisHave feedback on this article? Concerned about the content? Get in touch with us directly. Alternatively, email editorial-team (at) simplywallst.com.
This article by Simply Wall St is general in nature. We provide commentary based on historical data and analyst forecasts only using an unbiased methodology and our articles are not intended to be financial advice. It does not constitute a recommendation to buy or sell any stock, and does not take account of your objectives, or your financial situation. We aim to bring you long-term focused analysis driven by fundamental data. Note that our analysis may not factor in the latest price-sensitive company announcements or qualitative material. Simply Wall St has no position in any stocks mentioned.
About TSX:TECK.B
Teck Resources
Engages in exploring for, acquiring, developing, and producing natural resources in Asia, Europe, and North America.
Proven track record with adequate balance sheet.

