
Advertisement
- Canada
- /
- Metals and Mining
- /
- TSX:SAM
There's No Escaping Starcore International Mines Ltd.'s (TSE:SAM) Muted Revenues Despite A 29% Share Price Rise
Despite an already strong run, Starcore International Mines Ltd. (TSE:SAM) shares have been powering on, with a gain of 29% in the last thirty days. The last 30 days bring the annual gain to a very sharp 89%.
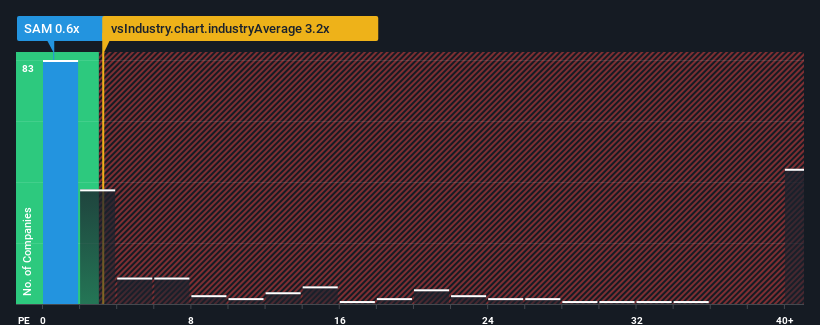
Even after such a large jump in price, Starcore International Mines' price-to-sales (or "P/S") ratio of 0.6x might still make it look like a strong buy right now compared to the wider Metals and Mining industry in Canada, where around half of the companies have P/S ratios above 3.2x and even P/S above 24x are quite common. Although, it's not wise to just take the P/S at face value as there may be an explanation why it's so limited.
View our latest analysis for Starcore International Mines
How Has Starcore International Mines Performed Recently?
Starcore International Mines certainly has been doing a great job lately as it's been growing its revenue at a really rapid pace. One possibility is that the P/S ratio is low because investors think this strong revenue growth might actually underperform the broader industry in the near future. If that doesn't eventuate, then existing shareholders have reason to be quite optimistic about the future direction of the share price.
We don't have analyst forecasts, but you can see how recent trends are setting up the company for the future by checking out our free report on Starcore International Mines' earnings, revenue and cash flow.Do Revenue Forecasts Match The Low P/S Ratio?
There's an inherent assumption that a company should far underperform the industry for P/S ratios like Starcore International Mines' to be considered reasonable.
If we review the last year of revenue growth, the company posted a terrific increase of 33%. The latest three year period has also seen an excellent 38% overall rise in revenue, aided by its short-term performance. Therefore, it's fair to say the revenue growth recently has been superb for the company.
This is in contrast to the rest of the industry, which is expected to grow by 70% over the next year, materially higher than the company's recent medium-term annualised growth rates.
With this information, we can see why Starcore International Mines is trading at a P/S lower than the industry. It seems most investors are expecting to see the recent limited growth rates continue into the future and are only willing to pay a reduced amount for the stock.
What We Can Learn From Starcore International Mines' P/S?
Even after such a strong price move, Starcore International Mines' P/S still trails the rest of the industry. It's argued the price-to-sales ratio is an inferior measure of value within certain industries, but it can be a powerful business sentiment indicator.
Our examination of Starcore International Mines confirms that the company's revenue trends over the past three-year years are a key factor in its low price-to-sales ratio, as we suspected, given they fall short of current industry expectations. Right now shareholders are accepting the low P/S as they concede future revenue probably won't provide any pleasant surprises. If recent medium-term revenue trends continue, it's hard to see the share price experience a reversal of fortunes anytime soon.
It is also worth noting that we have found 3 warning signs for Starcore International Mines (1 can't be ignored!) that you need to take into consideration.
If these risks are making you reconsider your opinion on Starcore International Mines, explore our interactive list of high quality stocks to get an idea of what else is out there.
New: Manage All Your Stock Portfolios in One Place
We've created the ultimate portfolio companion for stock investors, and it's free.
• Connect an unlimited number of Portfolios and see your total in one currency
• Be alerted to new Warning Signs or Risks via email or mobile
• Track the Fair Value of your stocks
Have feedback on this article? Concerned about the content? Get in touch with us directly. Alternatively, email editorial-team (at) simplywallst.com.
This article by Simply Wall St is general in nature. We provide commentary based on historical data and analyst forecasts only using an unbiased methodology and our articles are not intended to be financial advice. It does not constitute a recommendation to buy or sell any stock, and does not take account of your objectives, or your financial situation. We aim to bring you long-term focused analysis driven by fundamental data. Note that our analysis may not factor in the latest price-sensitive company announcements or qualitative material. Simply Wall St has no position in any stocks mentioned.
About TSX:SAM
Starcore International Mines
Through its subsidiary, Compañia Minera Peña de Bernal, S.A.
Flawless balance sheet with moderate risk.
Market Insights

Advertisement
Community Narratives
MicroVision will explode future revenue by 380.37% with a vision towards success
Fair Value US$60.00|98.5% undervalued
TH
Community Contributor
The Indispensable Artery for a New North American Economy
Fair Value CA$132.87|2.3% undervalued
TI
Community Contributor