
Advertisement
- Canada
- /
- Metals and Mining
- /
- TSX:SAM
Starcore International Mines Ltd.'s (TSE:SAM) 27% Dip In Price Shows Sentiment Is Matching Revenues
Starcore International Mines Ltd. (TSE:SAM) shareholders that were waiting for something to happen have been dealt a blow with a 27% share price drop in the last month. Longer-term shareholders will rue the drop in the share price, since it's now virtually flat for the year after a promising few quarters.
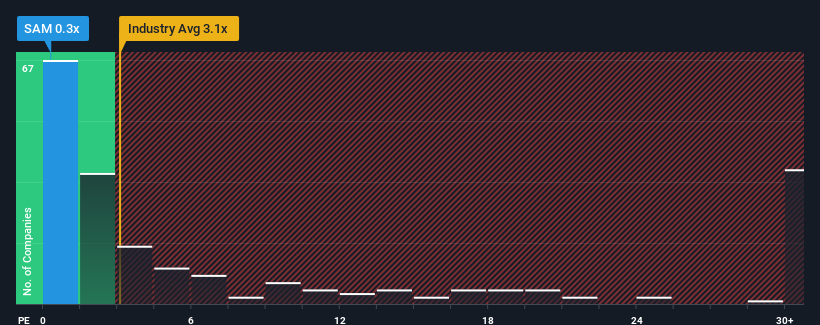
Following the heavy fall in price, Starcore International Mines may look like a strong buying opportunity at present with its price-to-sales (or "P/S") ratio of 0.3x, considering almost half of all companies in the Metals and Mining industry in Canada have P/S ratios greater than 3.1x and even P/S higher than 17x aren't out of the ordinary. However, the P/S might be quite low for a reason and it requires further investigation to determine if it's justified.
View our latest analysis for Starcore International Mines
How Has Starcore International Mines Performed Recently?
The revenue growth achieved at Starcore International Mines over the last year would be more than acceptable for most companies. Perhaps the market is expecting this acceptable revenue performance to take a dive, which has kept the P/S suppressed. If that doesn't eventuate, then existing shareholders have reason to be optimistic about the future direction of the share price.
Although there are no analyst estimates available for Starcore International Mines, take a look at this free data-rich visualisation to see how the company stacks up on earnings, revenue and cash flow.Do Revenue Forecasts Match The Low P/S Ratio?
In order to justify its P/S ratio, Starcore International Mines would need to produce anemic growth that's substantially trailing the industry.
If we review the last year of revenue growth, the company posted a terrific increase of 24%. As a result, it also grew revenue by 5.7% in total over the last three years. So we can start by confirming that the company has actually done a good job of growing revenue over that time.
Comparing the recent medium-term revenue trends against the industry's one-year growth forecast of 33% shows it's noticeably less attractive.
In light of this, it's understandable that Starcore International Mines' P/S sits below the majority of other companies. Apparently many shareholders weren't comfortable holding on to something they believe will continue to trail the wider industry.
The Final Word
Starcore International Mines' P/S looks about as weak as its stock price lately. Typically, we'd caution against reading too much into price-to-sales ratios when settling on investment decisions, though it can reveal plenty about what other market participants think about the company.
As we suspected, our examination of Starcore International Mines revealed its three-year revenue trends are contributing to its low P/S, given they look worse than current industry expectations. Right now shareholders are accepting the low P/S as they concede future revenue probably won't provide any pleasant surprises. Unless the recent medium-term conditions improve, they will continue to form a barrier for the share price around these levels.
We don't want to rain on the parade too much, but we did also find 3 warning signs for Starcore International Mines (2 shouldn't be ignored!) that you need to be mindful of.
If these risks are making you reconsider your opinion on Starcore International Mines, explore our interactive list of high quality stocks to get an idea of what else is out there.
New: Manage All Your Stock Portfolios in One Place
We've created the ultimate portfolio companion for stock investors, and it's free.
• Connect an unlimited number of Portfolios and see your total in one currency
• Be alerted to new Warning Signs or Risks via email or mobile
• Track the Fair Value of your stocks
Have feedback on this article? Concerned about the content? Get in touch with us directly. Alternatively, email editorial-team (at) simplywallst.com.
This article by Simply Wall St is general in nature. We provide commentary based on historical data and analyst forecasts only using an unbiased methodology and our articles are not intended to be financial advice. It does not constitute a recommendation to buy or sell any stock, and does not take account of your objectives, or your financial situation. We aim to bring you long-term focused analysis driven by fundamental data. Note that our analysis may not factor in the latest price-sensitive company announcements or qualitative material. Simply Wall St has no position in any stocks mentioned.
About TSX:SAM
Starcore International Mines
Through its subsidiary, Compañia Minera Peña de Bernal, S.A.
Flawless balance sheet with moderate risk.
Market Insights

Advertisement
Community Narratives
MicroVision will explode future revenue by 380.37% with a vision towards success
Fair Value US$60.00|98.5% undervalued
TH
Community Contributor
The Indispensable Artery for a New North American Economy
Fair Value CA$132.87|1.3% undervalued
TI
Community Contributor