
Advertisement
- Canada
- /
- Metals and Mining
- /
- TSX:SAM
Starcore International Mines Ltd. (TSE:SAM) Surges 52% Yet Its Low P/S Is No Reason For Excitement
Starcore International Mines Ltd. (TSE:SAM) shares have continued their recent momentum with a 52% gain in the last month alone. The annual gain comes to 144% following the latest surge, making investors sit up and take notice.
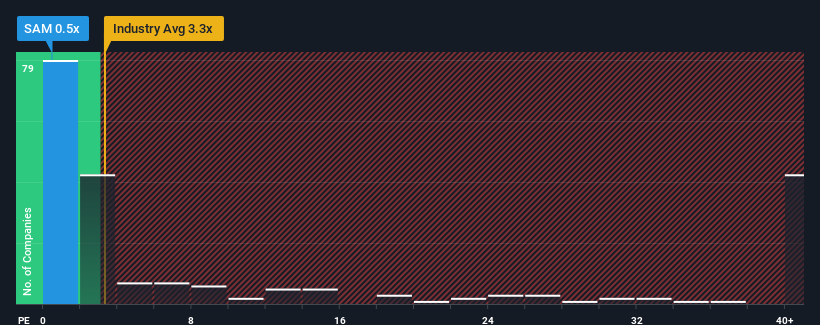
Even after such a large jump in price, Starcore International Mines may still be sending very bullish signals at the moment with its price-to-sales (or "P/S") ratio of 0.5x, since almost half of all companies in the Metals and Mining industry in Canada have P/S ratios greater than 3.3x and even P/S higher than 26x are not unusual. However, the P/S might be quite low for a reason and it requires further investigation to determine if it's justified.
Check out our latest analysis for Starcore International Mines
What Does Starcore International Mines' P/S Mean For Shareholders?
With revenue growth that's exceedingly strong of late, Starcore International Mines has been doing very well. Perhaps the market is expecting future revenue performance to dwindle, which has kept the P/S suppressed. If that doesn't eventuate, then existing shareholders have reason to be quite optimistic about the future direction of the share price.
Although there are no analyst estimates available for Starcore International Mines, take a look at this free data-rich visualisation to see how the company stacks up on earnings, revenue and cash flow.What Are Revenue Growth Metrics Telling Us About The Low P/S?
There's an inherent assumption that a company should far underperform the industry for P/S ratios like Starcore International Mines' to be considered reasonable.
Taking a look back first, we see that the company grew revenue by an impressive 33% last year. The latest three year period has also seen an excellent 38% overall rise in revenue, aided by its short-term performance. So we can start by confirming that the company has done a great job of growing revenue over that time.
Comparing that to the industry, which is predicted to deliver 90% growth in the next 12 months, the company's momentum is weaker, based on recent medium-term annualised revenue results.
In light of this, it's understandable that Starcore International Mines' P/S sits below the majority of other companies. It seems most investors are expecting to see the recent limited growth rates continue into the future and are only willing to pay a reduced amount for the stock.
What We Can Learn From Starcore International Mines' P/S?
Shares in Starcore International Mines have risen appreciably however, its P/S is still subdued. Using the price-to-sales ratio alone to determine if you should sell your stock isn't sensible, however it can be a practical guide to the company's future prospects.
In line with expectations, Starcore International Mines maintains its low P/S on the weakness of its recent three-year growth being lower than the wider industry forecast. Right now shareholders are accepting the low P/S as they concede future revenue probably won't provide any pleasant surprises. Unless the recent medium-term conditions improve, they will continue to form a barrier for the share price around these levels.
Plus, you should also learn about these 3 warning signs we've spotted with Starcore International Mines (including 2 which can't be ignored).
It's important to make sure you look for a great company, not just the first idea you come across. So if growing profitability aligns with your idea of a great company, take a peek at this free list of interesting companies with strong recent earnings growth (and a low P/E).
New: Manage All Your Stock Portfolios in One Place
We've created the ultimate portfolio companion for stock investors, and it's free.
• Connect an unlimited number of Portfolios and see your total in one currency
• Be alerted to new Warning Signs or Risks via email or mobile
• Track the Fair Value of your stocks
Have feedback on this article? Concerned about the content? Get in touch with us directly. Alternatively, email editorial-team (at) simplywallst.com.
This article by Simply Wall St is general in nature. We provide commentary based on historical data and analyst forecasts only using an unbiased methodology and our articles are not intended to be financial advice. It does not constitute a recommendation to buy or sell any stock, and does not take account of your objectives, or your financial situation. We aim to bring you long-term focused analysis driven by fundamental data. Note that our analysis may not factor in the latest price-sensitive company announcements or qualitative material. Simply Wall St has no position in any stocks mentioned.
About TSX:SAM
Starcore International Mines
Through its subsidiary, Compañia Minera Peña de Bernal, S.A.
Flawless balance sheet with moderate risk.
Market Insights

Advertisement
Community Narratives
MicroVision will explode future revenue by 380.37% with a vision towards success
Fair Value US$60.00|98.5% undervalued
TH
Community Contributor
The Indispensable Artery for a New North American Economy
Fair Value CA$132.87|1.3% undervalued
TI
Community Contributor