
Advertisement
Howard Marks put it nicely when he said that, rather than worrying about share price volatility, 'The possibility of permanent loss is the risk I worry about... and every practical investor I know worries about.' So it seems the smart money knows that debt - which is usually involved in bankruptcies - is a very important factor, when you assess how risky a company is. Importantly, NanoXplore Inc. (TSE:GRA) does carry debt. But the real question is whether this debt is making the company risky.
What Risk Does Debt Bring?
Debt and other liabilities become risky for a business when it cannot easily fulfill those obligations, either with free cash flow or by raising capital at an attractive price. Part and parcel of capitalism is the process of 'creative destruction' where failed businesses are mercilessly liquidated by their bankers. However, a more frequent (but still costly) occurrence is where a company must issue shares at bargain-basement prices, permanently diluting shareholders, just to shore up its balance sheet. By replacing dilution, though, debt can be an extremely good tool for businesses that need capital to invest in growth at high rates of return. The first step when considering a company's debt levels is to consider its cash and debt together.
Check out our latest analysis for NanoXplore
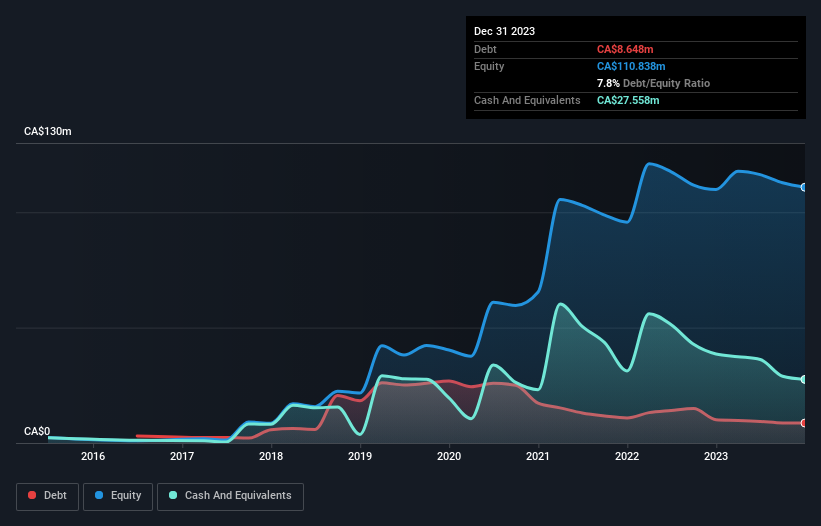
What Is NanoXplore's Debt?
As you can see below, NanoXplore had CA$8.65m of debt at December 2023, down from CA$10.1m a year prior. However, it does have CA$27.6m in cash offsetting this, leading to net cash of CA$18.9m.
How Strong Is NanoXplore's Balance Sheet?
Zooming in on the latest balance sheet data, we can see that NanoXplore had liabilities of CA$27.2m due within 12 months and liabilities of CA$16.4m due beyond that. Offsetting this, it had CA$27.6m in cash and CA$19.7m in receivables that were due within 12 months. So it actually has CA$3.73m more liquid assets than total liabilities.
Having regard to NanoXplore's size, it seems that its liquid assets are well balanced with its total liabilities. So it's very unlikely that the CA$397.4m company is short on cash, but still worth keeping an eye on the balance sheet. Succinctly put, NanoXplore boasts net cash, so it's fair to say it does not have a heavy debt load! There's no doubt that we learn most about debt from the balance sheet. But it is future earnings, more than anything, that will determine NanoXplore's ability to maintain a healthy balance sheet going forward. So if you're focused on the future you can check out this free report showing analyst profit forecasts.
In the last year NanoXplore wasn't profitable at an EBIT level, but managed to grow its revenue by 6.3%, to CA$123m. We usually like to see faster growth from unprofitable companies, but each to their own.
So How Risky Is NanoXplore?
By their very nature companies that are losing money are more risky than those with a long history of profitability. And in the last year NanoXplore had an earnings before interest and tax (EBIT) loss, truth be told. And over the same period it saw negative free cash outflow of CA$4.9m and booked a CA$11m accounting loss. While this does make the company a bit risky, it's important to remember it has net cash of CA$18.9m. That kitty means the company can keep spending for growth for at least two years, at current rates. Even though its balance sheet seems sufficiently liquid, debt always makes us a little nervous if a company doesn't produce free cash flow regularly. For riskier companies like NanoXplore I always like to keep an eye on whether insiders are buying or selling. So click here if you want to find out for yourself.
Of course, if you're the type of investor who prefers buying stocks without the burden of debt, then don't hesitate to discover our exclusive list of net cash growth stocks, today.
Valuation is complex, but we're here to simplify it.
Discover if NanoXplore might be undervalued or overvalued with our detailed analysis, featuring fair value estimates, potential risks, dividends, insider trades, and its financial condition.
Access Free AnalysisHave feedback on this article? Concerned about the content? Get in touch with us directly. Alternatively, email editorial-team (at) simplywallst.com.
This article by Simply Wall St is general in nature. We provide commentary based on historical data and analyst forecasts only using an unbiased methodology and our articles are not intended to be financial advice. It does not constitute a recommendation to buy or sell any stock, and does not take account of your objectives, or your financial situation. We aim to bring you long-term focused analysis driven by fundamental data. Note that our analysis may not factor in the latest price-sensitive company announcements or qualitative material. Simply Wall St has no position in any stocks mentioned.
About TSX:GRA
NanoXplore
A graphene company, manufactures and supplies graphene powder for use in transportation and industrial markets in Australia.
Flawless balance sheet with high growth potential.
Similar Companies
Market Insights

Advertisement
Community Narratives
MicroVision will explode future revenue by 380.37% with a vision towards success
Fair Value US$60.00|98.4% undervalued
TH
Community Contributor
The Indispensable Artery for a New North American Economy
Fair Value CA$132.87|1.3% undervalued
TI
Community Contributor