Advertisement
- Canada
- /
- Metals and Mining
- /
- TSX:BTO
Does B2Gold’s Recent Pullback Signal Opportunity After Development Project Updates?

Simply Wall St
Reviewed by Bailey Pemberton
- If you have ever wondered whether B2Gold is a bargain or overpriced in today's market, you are in the right place for a deep dive into what the numbers really say.
- Even with B2Gold’s share price up 60.9% year-to-date and a 35.1% rise over the past year, the recent pullback of 14.1% in the last week and nearly 15.7% over the last month hints at shifting tides for the stock.
- This volatility comes on the back of fresh developments in the gold sector. B2Gold recently announced the continuation of its development projects and is growing its resource base in Africa and the Philippines. Investors have also responded to broader gold price swings and speculation around potential central bank actions, adding more fuel to recent moves.
- When assessing its value fundamentals, B2Gold scores 5 out of 6 on our valuation scorecard for being undervalued. In the next section, we will dig into these valuation checks and compare the usual metrics. Stick around to find out why there may be an even smarter way to understand whether B2Gold is really worth your attention.
Find out why B2Gold's 35.1% return over the last year is lagging behind its peers.
Approach 1: B2Gold Discounted Cash Flow (DCF) Analysis
The Discounted Cash Flow (DCF) model is widely used for valuing companies. It works by projecting a business's future cash flows, then discounting those cash flows back to reflect their value in today's terms. In other words, it estimates what B2Gold’s future profits are really worth in the present, factoring in the time value of money and investment risk.
For B2Gold, the most recent reported Free Cash Flow sits at around negative $297 Million. However, analysts expect improvement in the years ahead, projecting Free Cash Flow to reach $1.86 Billion by 2029. Looking further out, Simply Wall St applies its model to extrapolate Free Cash Flow beyond analysts’ direct estimates, still reflecting robust underlying growth for the business.
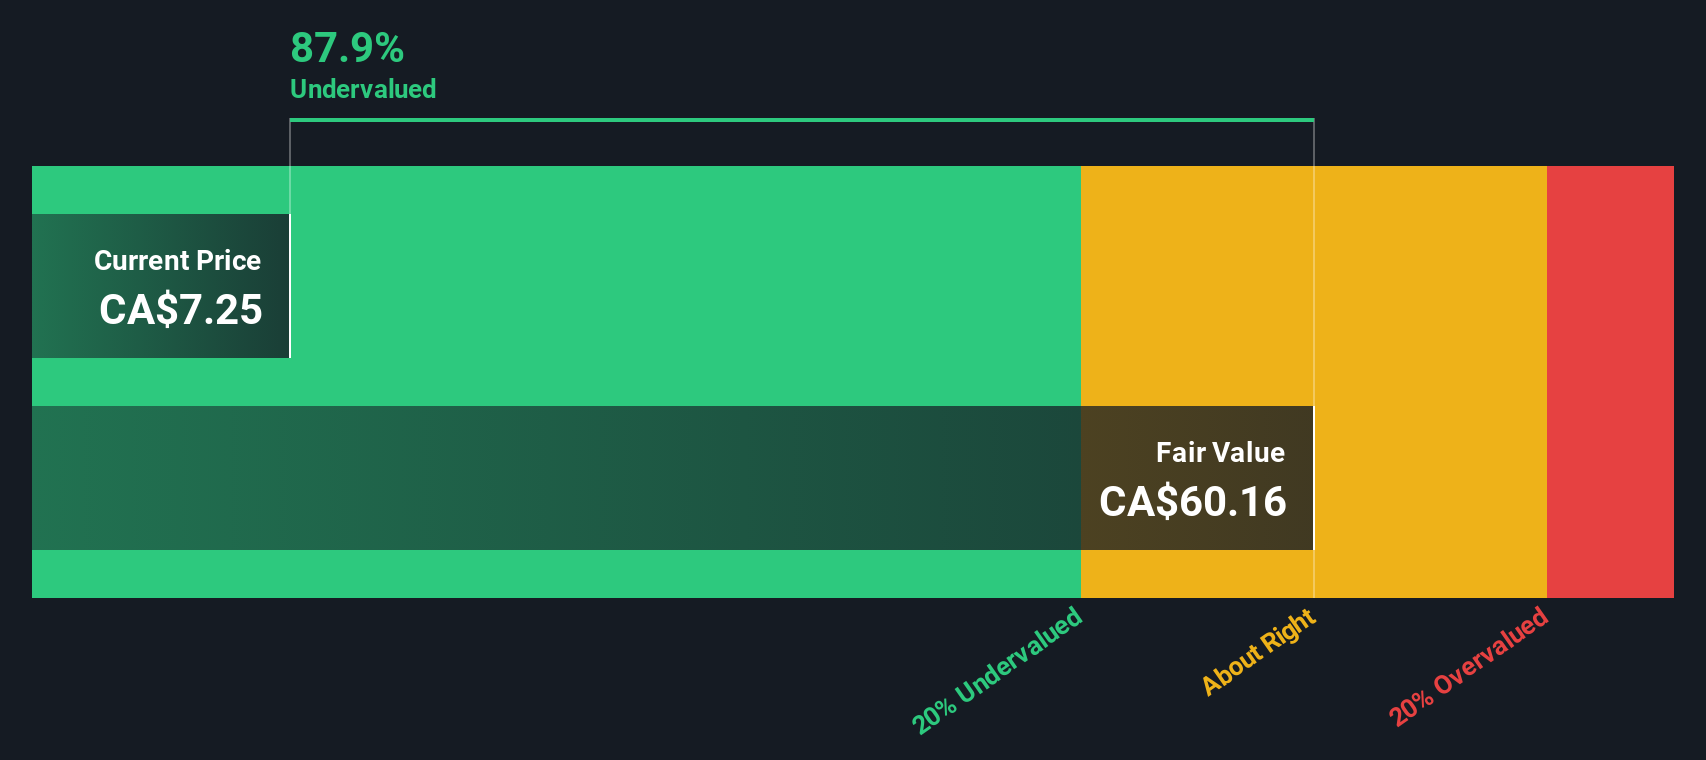
Based on these cash flow projections and the two-stage Free Cash Flow to Equity DCF model, the estimated intrinsic value per share is $55.13. This suggests an 89.2% discount compared to the current price, which may indicate B2Gold is undervalued according to this method.
If you trust the cash flow estimates, the current market price could look attractive for long-term investors seeking value.
Result: UNDERVALUED
Our Discounted Cash Flow (DCF) analysis suggests B2Gold is undervalued by 89.2%. Track this in your watchlist or portfolio, or discover 841 more undervalued stocks based on cash flows.
Approach 2: B2Gold Price vs Sales
The price-to-sales (P/S) ratio is an effective valuation tool for companies like B2Gold, especially within the metals and mining industry. This ratio is particularly useful for comparing businesses with variable or negative earnings but resilient revenues, which is often the case for natural resource producers. The P/S multiple strips out the effects of non-cash charges and cyclical profit swings, offering a cleaner lens through which to gauge valuation.
Market expectations for future growth and the perceived risk of a company can both drive what’s considered a “fair” or “normal” P/S ratio. Companies with stronger growth prospects and lower risks generally command higher P/S multiples, as investors are willing to pay more for each dollar of revenue.
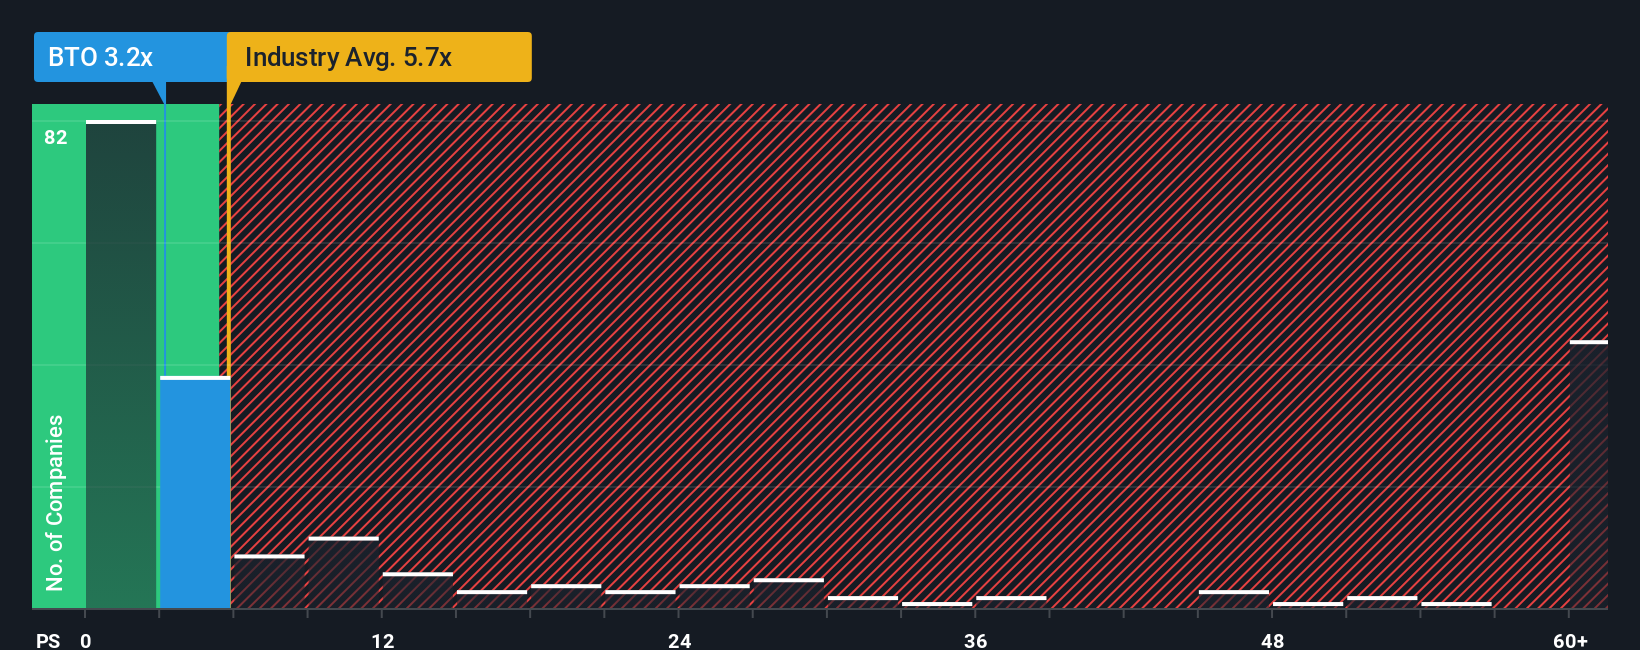
B2Gold currently trades at a P/S ratio of 2.59x. This is well below the industry average of 5.71x and also lower than its peer group’s average of 10.78x. However, Simply Wall St's proprietary “Fair Ratio” for B2Gold stands at 6.54x. The Fair Ratio reflects a tailored assessment, factoring in B2Gold’s expected growth, risk profile, profit margins, market cap, and the industry backdrop, offering a more robust benchmark than broad peer or industry averages alone.
Comparing B2Gold’s actual P/S multiple of 2.59x with its Fair Ratio of 6.54x, the stock appears undervalued relative to its fundamentals and outlook.
Result: UNDERVALUED
PS ratios tell one story, but what if the real opportunity lies elsewhere? Discover 1411 companies where insiders are betting big on explosive growth.
Upgrade Your Decision Making: Choose your B2Gold Narrative
Earlier we mentioned that there is an even better way to understand valuation, so let's introduce you to Narratives. A Narrative is essentially the story you believe about B2Gold; your perspective on how operational milestones, market shifts, or risks will shape the company’s future. Narratives bring investing to life by linking your view on the business to a real financial forecast and fair value estimate, helping you see not just the numbers, but the “why” behind them.
On Simply Wall St’s Community page, Narratives are an accessible and intuitive tool used by millions of investors. They empower you to build your own thesis for B2Gold, connecting the company’s strategy, upcoming projects, and potential risks to your forecast of future revenue, earnings, and margins. This means you can easily compare your calculated Fair Value to today’s share price and decide whether it's time to buy, sell, or hold, all while factoring in your level of conviction and flexibility about the future.
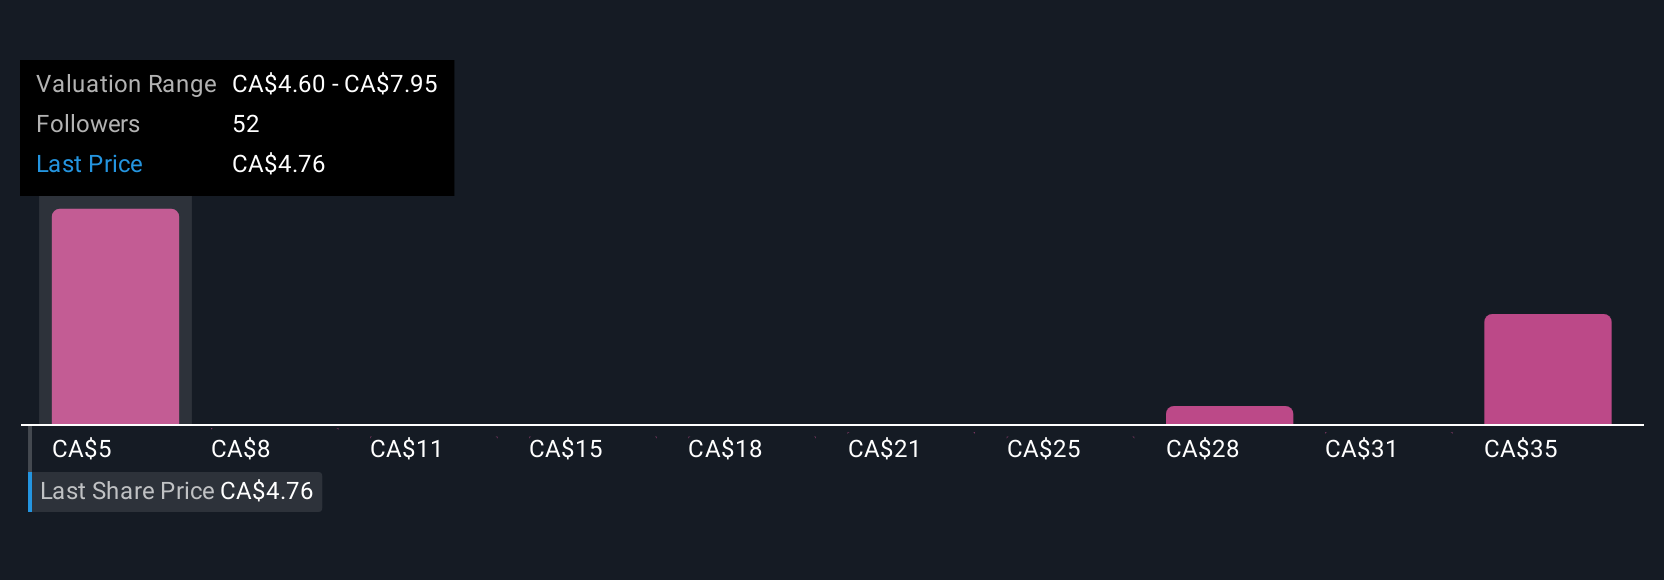
Narratives dynamically update whenever new news, financials, or company developments are published, ensuring your investment view always reflects the latest information. For example, some B2Gold investors might believe robust production growth and gold prices will push the fair value as high as CA$7.99 per share, while more cautious voices see risks capping it at CA$5.36. This shows how Narratives help you compare and make smarter, more personalized investment calls.
Do you think there's more to the story for B2Gold? Head over to our Community to see what others are saying!
This article by Simply Wall St is general in nature. We provide commentary based on historical data and analyst forecasts only using an unbiased methodology and our articles are not intended to be financial advice. It does not constitute a recommendation to buy or sell any stock, and does not take account of your objectives, or your financial situation. We aim to bring you long-term focused analysis driven by fundamental data. Note that our analysis may not factor in the latest price-sensitive company announcements or qualitative material. Simply Wall St has no position in any stocks mentioned.
Valuation is complex, but we're here to simplify it.
Discover if B2Gold might be undervalued or overvalued with our detailed analysis, featuring fair value estimates, potential risks, dividends, insider trades, and its financial condition.
Access Free AnalysisHave feedback on this article? Concerned about the content? Get in touch with us directly. Alternatively, email editorial-team@simplywallst.com
About TSX:BTO
Undervalued with reasonable growth potential.
Similar Companies
Market Insights

Advertisement
Community Narratives
The company that turned a verb into a global necessity and basically runs the modern internet, digital ads, smartphones, maps, and AI.
Fair Value US$300.00|5.4% undervalued
OS
Community Contributor
Flowers Foods Pays A Fair Price For Health
Fair Value US$16.12|26.3% undervalued
NV
Community Contributor
TMX Group will thrive with 33.3% profit margin and enduring market moat
Fair Value CA$49.90|4.1% overvalued
LI
Community Contributor
The "Molecular Pencil": Why Beam's Technology is Built to Win
Fair Value US$65.01|62.7% undervalued
DA
Community Contributor