Stock Analysis
Trisura Group (TSE:TSU) stock performs better than its underlying earnings growth over last five years


Buying shares in the best businesses can build meaningful wealth for you and your family. And we've seen some truly amazing gains over the years. Don't believe it? Then look at the Trisura Group Ltd. (TSE:TSU) share price. It's 494% higher than it was five years ago. This just goes to show the value creation that some businesses can achieve. Also pleasing for shareholders was the 14% gain in the last three months.
The past week has proven to be lucrative for Trisura Group investors, so let's see if fundamentals drove the company's five-year performance.
See our latest analysis for Trisura Group
To paraphrase Benjamin Graham: Over the short term the market is a voting machine, but over the long term it's a weighing machine. One imperfect but simple way to consider how the market perception of a company has shifted is to compare the change in the earnings per share (EPS) with the share price movement.
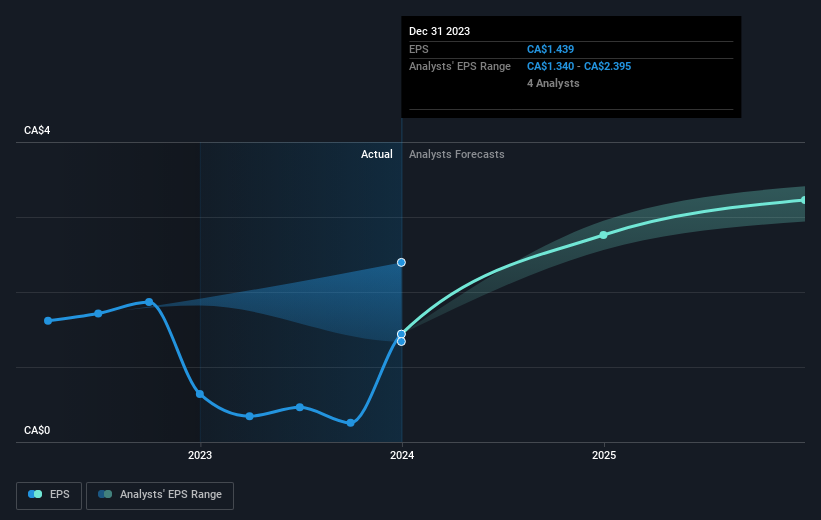
Over half a decade, Trisura Group managed to grow its earnings per share at 34% a year. This EPS growth is reasonably close to the 43% average annual increase in the share price. This indicates that investor sentiment towards the company has not changed a great deal. Indeed, it would appear the share price is reacting to the EPS.
The image below shows how EPS has tracked over time (if you click on the image you can see greater detail).
We like that insiders have been buying shares in the last twelve months. Even so, future earnings will be far more important to whether current shareholders make money. This free interactive report on Trisura Group's earnings, revenue and cash flow is a great place to start, if you want to investigate the stock further.
A Different Perspective
It's nice to see that Trisura Group shareholders have received a total shareholder return of 37% over the last year. Having said that, the five-year TSR of 43% a year, is even better. While it is well worth considering the different impacts that market conditions can have on the share price, there are other factors that are even more important. Take risks, for example - Trisura Group has 2 warning signs we think you should be aware of.
If you like to buy stocks alongside management, then you might just love this free list of companies. (Hint: insiders have been buying them).
Please note, the market returns quoted in this article reflect the market weighted average returns of stocks that currently trade on Canadian exchanges.
Valuation is complex, but we're helping make it simple.
Find out whether Trisura Group is potentially over or undervalued by checking out our comprehensive analysis, which includes fair value estimates, risks and warnings, dividends, insider transactions and financial health.
View the Free AnalysisHave feedback on this article? Concerned about the content? Get in touch with us directly. Alternatively, email editorial-team (at) simplywallst.com.
This article by Simply Wall St is general in nature. We provide commentary based on historical data and analyst forecasts only using an unbiased methodology and our articles are not intended to be financial advice. It does not constitute a recommendation to buy or sell any stock, and does not take account of your objectives, or your financial situation. We aim to bring you long-term focused analysis driven by fundamental data. Note that our analysis may not factor in the latest price-sensitive company announcements or qualitative material. Simply Wall St has no position in any stocks mentioned.
About TSX:TSU
Trisura Group
Trisura Group Ltd., a specialty insurance company, operates in the surety, risk solutions, corporate insurance, and reinsurance businesses in Canada, the United States, and internationally.
Flawless balance sheet with solid track record.
