
Advertisement
- Canada
- /
- Oil and Gas
- /
- TSX:VET
We Think That There Are Issues Underlying Vermilion Energy's (TSE:VET) Earnings

Despite announcing strong earnings, Vermilion Energy Inc.'s (TSE:VET) stock was sluggish. We did some digging and found some worrying underlying problems.
A Closer Look At Vermilion Energy's Earnings
As finance nerds would already know, the accrual ratio from cashflow is a key measure for assessing how well a company's free cash flow (FCF) matches its profit. To get the accrual ratio we first subtract FCF from profit for a period, and then divide that number by the average operating assets for the period. You could think of the accrual ratio from cashflow as the 'non-FCF profit ratio'.
Therefore, it's actually considered a good thing when a company has a negative accrual ratio, but a bad thing if its accrual ratio is positive. That is not intended to imply we should worry about a positive accrual ratio, but it's worth noting where the accrual ratio is rather high. Notably, there is some academic evidence that suggests that a high accrual ratio is a bad sign for near-term profits, generally speaking.
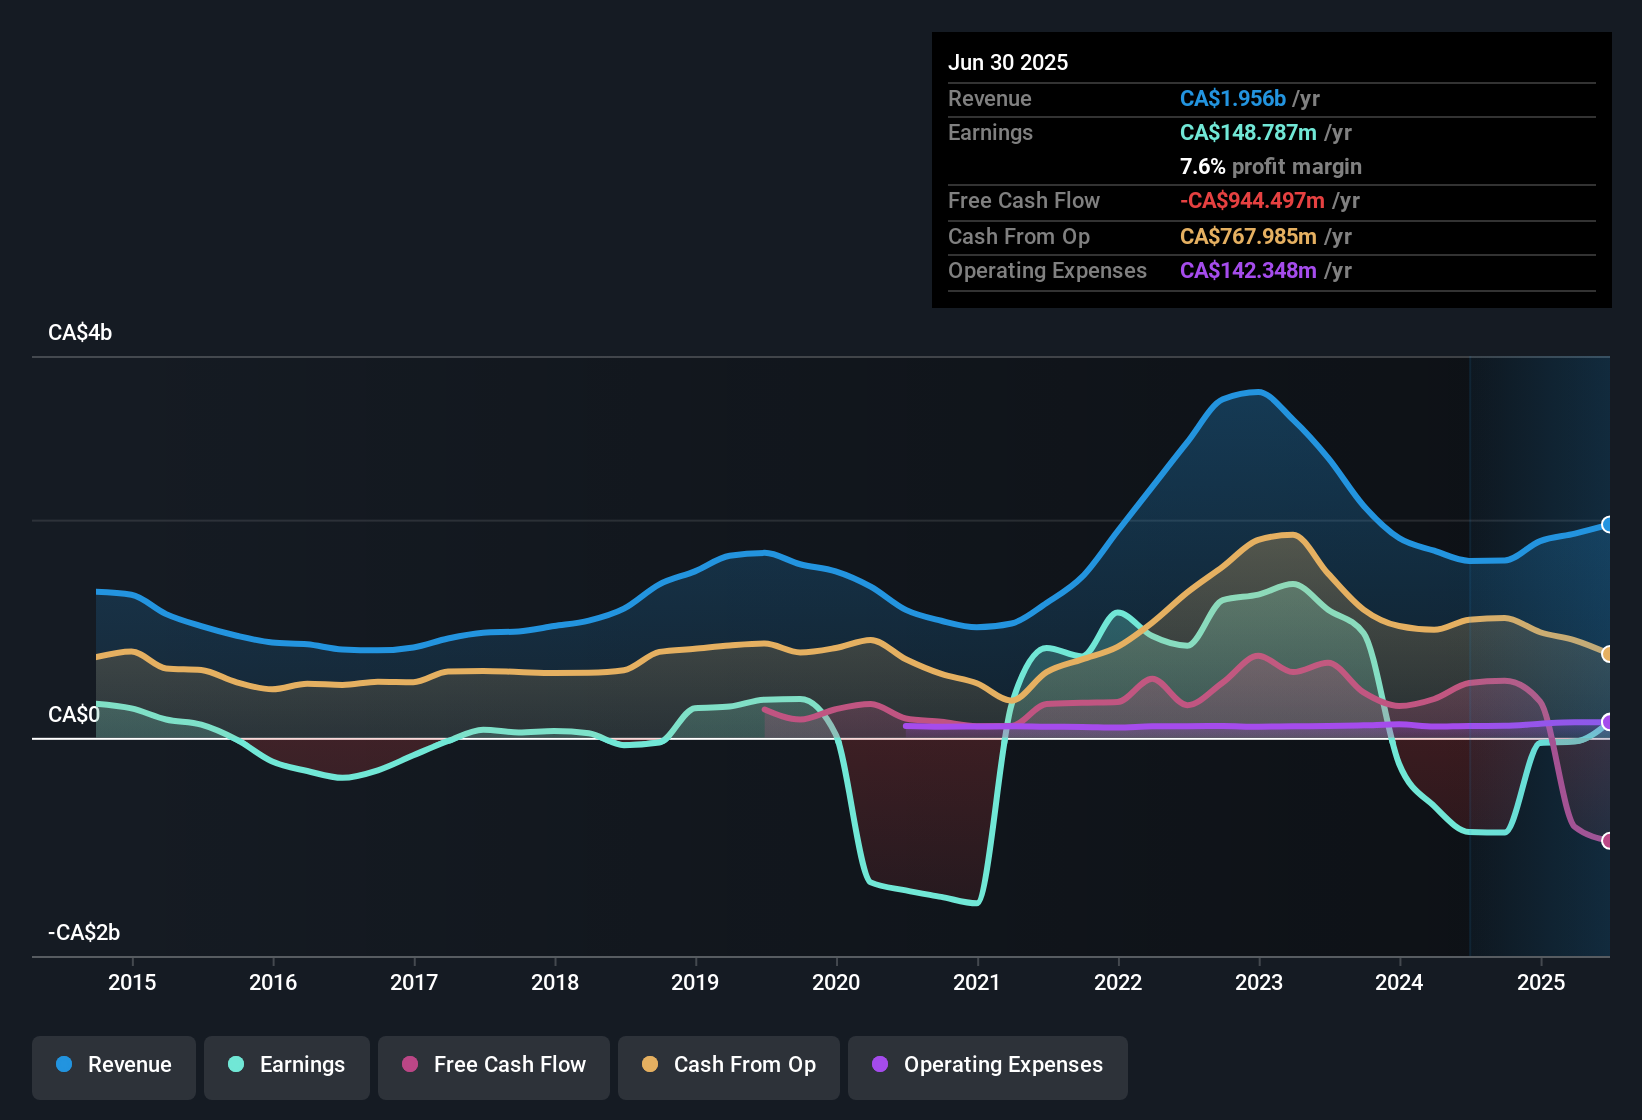
For the year to June 2025, Vermilion Energy had an accrual ratio of 0.27. Therefore, we know that it's free cashflow was significantly lower than its statutory profit, which is hardly a good thing. Over the last year it actually had negative free cash flow of CA$944m, in contrast to the aforementioned profit of CA$148.8m. It's worth noting that Vermilion Energy generated positive FCF of CA$502m a year ago, so at least they've done it in the past. One positive for Vermilion Energy shareholders is that it's accrual ratio was significantly better last year, providing reason to believe that it may return to stronger cash conversion in the future. Shareholders should look for improved cashflow relative to profit in the current year, if that is indeed the case.
That might leave you wondering what analysts are forecasting in terms of future profitability. Luckily, you can click here to see an interactive graph depicting future profitability, based on their estimates.
Our Take On Vermilion Energy's Profit Performance
Vermilion Energy didn't convert much of its profit to free cash flow in the last year, which some investors may consider rather suboptimal. Therefore, it seems possible to us that Vermilion Energy's true underlying earnings power is actually less than its statutory profit. On the bright side, the company showed enough improvement to book a profit this year, after losing money last year. At the end of the day, it's essential to consider more than just the factors above, if you want to understand the company properly. So if you'd like to dive deeper into this stock, it's crucial to consider any risks it's facing. Be aware that Vermilion Energy is showing 4 warning signs in our investment analysis and 2 of those are concerning...
This note has only looked at a single factor that sheds light on the nature of Vermilion Energy's profit. But there are plenty of other ways to inform your opinion of a company. Some people consider a high return on equity to be a good sign of a quality business. While it might take a little research on your behalf, you may find this free collection of companies boasting high return on equity, or this list of stocks with significant insider holdings to be useful.
New: Manage All Your Stock Portfolios in One Place
We've created the ultimate portfolio companion for stock investors, and it's free.
• Connect an unlimited number of Portfolios and see your total in one currency
• Be alerted to new Warning Signs or Risks via email or mobile
• Track the Fair Value of your stocks
Have feedback on this article? Concerned about the content? Get in touch with us directly. Alternatively, email editorial-team (at) simplywallst.com.
This article by Simply Wall St is general in nature. We provide commentary based on historical data and analyst forecasts only using an unbiased methodology and our articles are not intended to be financial advice. It does not constitute a recommendation to buy or sell any stock, and does not take account of your objectives, or your financial situation. We aim to bring you long-term focused analysis driven by fundamental data. Note that our analysis may not factor in the latest price-sensitive company announcements or qualitative material. Simply Wall St has no position in any stocks mentioned.
About TSX:VET
Vermilion Energy
An oil and gas producer, focuses on the acquisition, exploration, development, and optimization of producing properties in North America, Europe, and Australia.
Fair value with moderate growth potential.
Similar Companies
Market Insights

Advertisement
Community Narratives
MicroVision will explode future revenue by 380.37% with a vision towards success
Fair Value US$60.00|98.4% undervalued
TH
Community Contributor
The Indispensable Artery for a New North American Economy
Fair Value CA$132.87|1.3% undervalued
TI
Community Contributor