- Canada
- /
- Oil and Gas
- /
- TSX:PXT
Parex Resources (TSE:PXT) shareholders have lost 25% over 1 year, earnings decline likely the culprit


The simplest way to benefit from a rising market is to buy an index fund. When you buy individual stocks, you can make higher profits, but you also face the risk of under-performance. That downside risk was realized by Parex Resources Inc. (TSE:PXT) shareholders over the last year, as the share price declined 29%. That falls noticeably short of the market return of around 16%. At least the damage isn't so bad if you look at the last three years, since the stock is down 4.3% in that time. The falls have accelerated recently, with the share price down 22% in the last three months. We note that the company has reported results fairly recently; and the market is hardly delighted. You can check out the latest numbers in our company report.
If the past week is anything to go by, investor sentiment for Parex Resources isn't positive, so let's see if there's a mismatch between fundamentals and the share price.
Check out our latest analysis for Parex Resources
In his essay The Superinvestors of Graham-and-Doddsville Warren Buffett described how share prices do not always rationally reflect the value of a business. By comparing earnings per share (EPS) and share price changes over time, we can get a feel for how investor attitudes to a company have morphed over time.
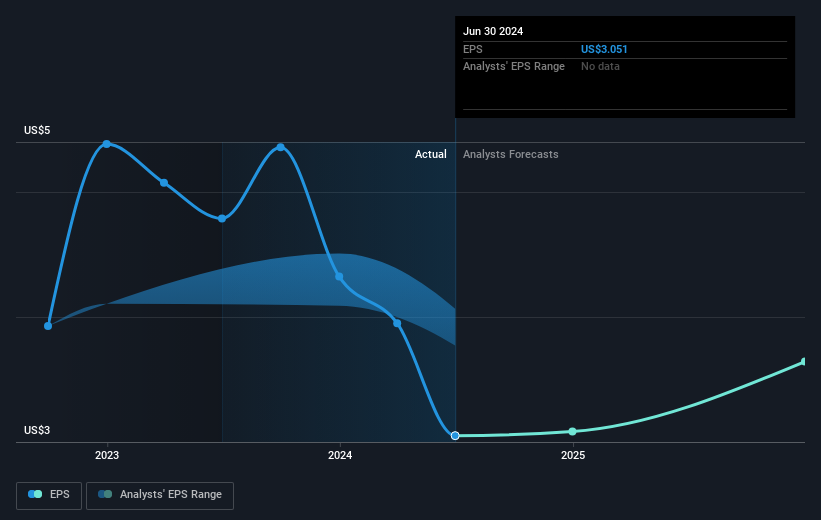
Unhappily, Parex Resources had to report a 36% decline in EPS over the last year. The share price fall of 29% isn't as bad as the reduction in earnings per share. It may have been that the weak EPS was not as bad as some had feared.
The company's earnings per share (over time) is depicted in the image below (click to see the exact numbers).
It's good to see that there was some significant insider buying in the last three months. That's a positive. On the other hand, we think the revenue and earnings trends are much more meaningful measures of the business. Before buying or selling a stock, we always recommend a close examination of historic growth trends, available here..
What About Dividends?
It is important to consider the total shareholder return, as well as the share price return, for any given stock. The TSR is a return calculation that accounts for the value of cash dividends (assuming that any dividend received was reinvested) and the calculated value of any discounted capital raisings and spin-offs. It's fair to say that the TSR gives a more complete picture for stocks that pay a dividend. As it happens, Parex Resources' TSR for the last 1 year was -25%, which exceeds the share price return mentioned earlier. This is largely a result of its dividend payments!
A Different Perspective
Parex Resources shareholders are down 25% for the year (even including dividends), but the market itself is up 16%. However, keep in mind that even the best stocks will sometimes underperform the market over a twelve month period. On the bright side, long term shareholders have made money, with a gain of 0.8% per year over half a decade. It could be that the recent sell-off is an opportunity, so it may be worth checking the fundamental data for signs of a long term growth trend. It's always interesting to track share price performance over the longer term. But to understand Parex Resources better, we need to consider many other factors. Take risks, for example - Parex Resources has 3 warning signs we think you should be aware of.
If you like to buy stocks alongside management, then you might just love this free list of companies. (Hint: most of them are flying under the radar).
Please note, the market returns quoted in this article reflect the market weighted average returns of stocks that currently trade on Canadian exchanges.
New: Manage All Your Stock Portfolios in One Place
We've created the ultimate portfolio companion for stock investors, and it's free.
• Connect an unlimited number of Portfolios and see your total in one currency
• Be alerted to new Warning Signs or Risks via email or mobile
• Track the Fair Value of your stocks
Have feedback on this article? Concerned about the content? Get in touch with us directly. Alternatively, email editorial-team (at) simplywallst.com.
This article by Simply Wall St is general in nature. We provide commentary based on historical data and analyst forecasts only using an unbiased methodology and our articles are not intended to be financial advice. It does not constitute a recommendation to buy or sell any stock, and does not take account of your objectives, or your financial situation. We aim to bring you long-term focused analysis driven by fundamental data. Note that our analysis may not factor in the latest price-sensitive company announcements or qualitative material. Simply Wall St has no position in any stocks mentioned.
Have feedback on this article? Concerned about the content? Get in touch with us directly. Alternatively, email editorial-team@simplywallst.com
About TSX:PXT
Parex Resources
Engages in the exploration, development, production, and marketing of oil and natural gas in Colombia.
Undervalued with excellent balance sheet and pays a dividend.

