- Canada
- /
- Capital Markets
- /
- TSX:RCG
RF Capital Group (TSE:RCG) adds CA$21m to market cap in the past 7 days, though investors from five years ago are still down 59%


This week we saw the RF Capital Group Inc. (TSE:RCG) share price climb by 26%. But that doesn't change the fact that the returns over the last half decade have been disappointing. In that time the share price has delivered a rude shock to holders, who find themselves down 68% after a long stretch. So is the recent increase sufficient to restore confidence in the stock? Not yet. We'd err towards caution given the long term under-performance.
Although the past week has been more reassuring for shareholders, they're still in the red over the last five years, so let's see if the underlying business has been responsible for the decline.
See our latest analysis for RF Capital Group
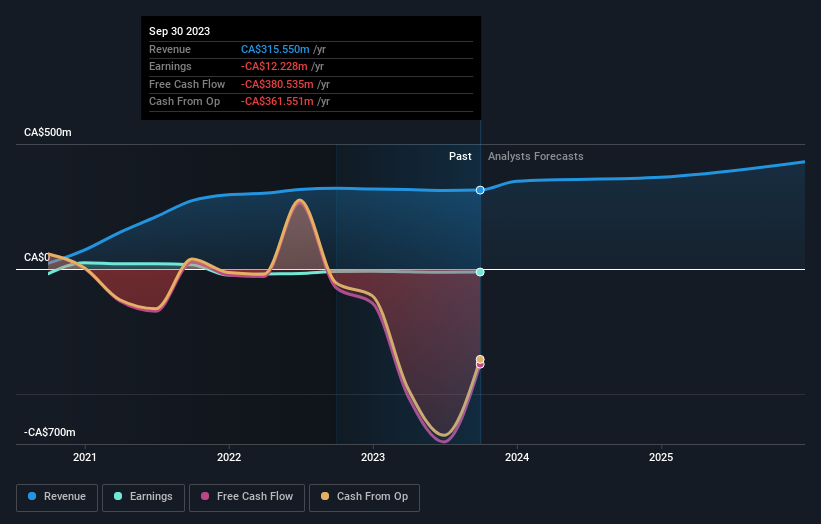
Because RF Capital Group made a loss in the last twelve months, we think the market is probably more focussed on revenue and revenue growth, at least for now. Shareholders of unprofitable companies usually expect strong revenue growth. That's because fast revenue growth can be easily extrapolated to forecast profits, often of considerable size.
Over five years, RF Capital Group grew its revenue at 51% per year. That's better than most loss-making companies. In contrast, the share price is has averaged a loss of 11% per year - that's quite disappointing. It's safe to say investor expectations are more grounded now. If you think the company can keep up its revenue growth, you'd have to consider the possibility that there's an opportunity here.
The image below shows how earnings and revenue have tracked over time (if you click on the image you can see greater detail).
You can see how its balance sheet has strengthened (or weakened) over time in this free interactive graphic.
What About The Total Shareholder Return (TSR)?
We'd be remiss not to mention the difference between RF Capital Group's total shareholder return (TSR) and its share price return. The TSR is a return calculation that accounts for the value of cash dividends (assuming that any dividend received was reinvested) and the calculated value of any discounted capital raisings and spin-offs. RF Capital Group's TSR of was a loss of 59% for the 5 years. That wasn't as bad as its share price return, because it has paid dividends.
A Different Perspective
While the broader market gained around 0.8% in the last year, RF Capital Group shareholders lost 55%. Even the share prices of good stocks drop sometimes, but we want to see improvements in the fundamental metrics of a business, before getting too interested. Unfortunately, last year's performance may indicate unresolved challenges, given that it was worse than the annualised loss of 10% over the last half decade. We realise that Baron Rothschild has said investors should "buy when there is blood on the streets", but we caution that investors should first be sure they are buying a high quality business. I find it very interesting to look at share price over the long term as a proxy for business performance. But to truly gain insight, we need to consider other information, too. Case in point: We've spotted 3 warning signs for RF Capital Group you should be aware of, and 2 of them make us uncomfortable.
For those who like to find winning investments this free list of growing companies with recent insider purchasing, could be just the ticket.
Please note, the market returns quoted in this article reflect the market weighted average returns of stocks that currently trade on Canadian exchanges.
New: AI Stock Screener & Alerts
Our new AI Stock Screener scans the market every day to uncover opportunities.
• Dividend Powerhouses (3%+ Yield)
• Undervalued Small Caps with Insider Buying
• High growth Tech and AI Companies
Or build your own from over 50 metrics.
Have feedback on this article? Concerned about the content? Get in touch with us directly. Alternatively, email editorial-team (at) simplywallst.com.
This article by Simply Wall St is general in nature. We provide commentary based on historical data and analyst forecasts only using an unbiased methodology and our articles are not intended to be financial advice. It does not constitute a recommendation to buy or sell any stock, and does not take account of your objectives, or your financial situation. We aim to bring you long-term focused analysis driven by fundamental data. Note that our analysis may not factor in the latest price-sensitive company announcements or qualitative material. Simply Wall St has no position in any stocks mentioned.
About TSX:RCG
Excellent balance sheet and fair value.

