
Advertisement
- Canada
- /
- Capital Markets
- /
- CNSX:VST
Victory Square Technologies Inc. (CSE:VST) Soars 53% But It's A Story Of Risk Vs Reward
Victory Square Technologies Inc. (CSE:VST) shares have continued their recent momentum with a 53% gain in the last month alone. The last 30 days were the cherry on top of the stock's 712% gain in the last year, which is nothing short of spectacular.
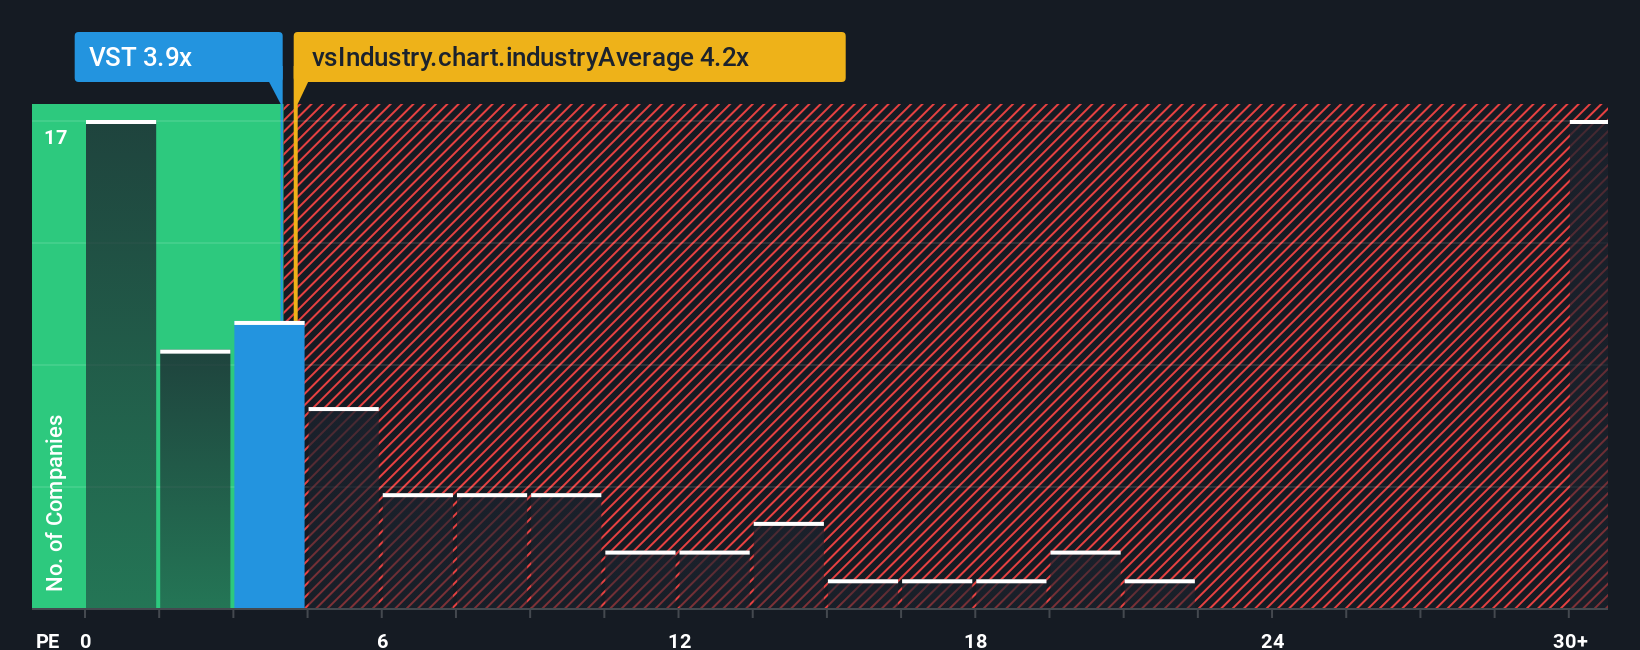
Even after such a large jump in price, it's still not a stretch to say that Victory Square Technologies' price-to-sales (or "P/S") ratio of 3.9x right now seems quite "middle-of-the-road" compared to the Capital Markets industry in Canada, where the median P/S ratio is around 4.2x. Although, it's not wise to simply ignore the P/S without explanation as investors may be disregarding a distinct opportunity or a costly mistake.
View our latest analysis for Victory Square Technologies
What Does Victory Square Technologies' Recent Performance Look Like?
Recent times have been quite advantageous for Victory Square Technologies as its revenue has been rising very briskly. It might be that many expect the strong revenue performance to wane, which has kept the share price, and thus the P/S ratio, from rising. If you like the company, you'd be hoping this isn't the case so that you could potentially pick up some stock while it's not quite in favour.
Although there are no analyst estimates available for Victory Square Technologies, take a look at this free data-rich visualisation to see how the company stacks up on earnings, revenue and cash flow.How Is Victory Square Technologies' Revenue Growth Trending?
In order to justify its P/S ratio, Victory Square Technologies would need to produce growth that's similar to the industry.
Taking a look back first, we see that the company grew revenue by an impressive 39% last year. Spectacularly, three year revenue growth has ballooned by several orders of magnitude, thanks in part to the last 12 months of revenue growth. Accordingly, shareholders would have been over the moon with those medium-term rates of revenue growth.
Comparing that to the industry, which is predicted to shrink 27% in the next 12 months, the company's positive momentum based on recent medium-term revenue results is a bright spot for the moment.
With this information, we find it odd that Victory Square Technologies is trading at a fairly similar P/S to the industry. Apparently some shareholders believe the recent performance is at its limits and have been accepting lower selling prices.
The Key Takeaway
Its shares have lifted substantially and now Victory Square Technologies' P/S is back within range of the industry median. It's argued the price-to-sales ratio is an inferior measure of value within certain industries, but it can be a powerful business sentiment indicator.
As mentioned previously, Victory Square Technologies currently trades on a P/S on par with the wider industry, but this is lower than expected considering its recent three-year revenue growth is beating forecasts for a struggling industry. When we see a history of positive growth in a struggling industry, but only an average P/S, we assume potential risks are what might be placing pressure on the P/S ratio. Perhaps there is some hesitation about the company's ability to stay its recent course and swim against the current of the broader industry turmoil. It appears some are indeed anticipating revenue instability, because this relative performance should normally provide a boost to the share price.
It's always necessary to consider the ever-present spectre of investment risk. We've identified 3 warning signs with Victory Square Technologies (at least 1 which shouldn't be ignored), and understanding these should be part of your investment process.
If companies with solid past earnings growth is up your alley, you may wish to see this free collection of other companies with strong earnings growth and low P/E ratios.
New: Manage All Your Stock Portfolios in One Place
We've created the ultimate portfolio companion for stock investors, and it's free.
• Connect an unlimited number of Portfolios and see your total in one currency
• Be alerted to new Warning Signs or Risks via email or mobile
• Track the Fair Value of your stocks
Have feedback on this article? Concerned about the content? Get in touch with us directly. Alternatively, email editorial-team (at) simplywallst.com.
This article by Simply Wall St is general in nature. We provide commentary based on historical data and analyst forecasts only using an unbiased methodology and our articles are not intended to be financial advice. It does not constitute a recommendation to buy or sell any stock, and does not take account of your objectives, or your financial situation. We aim to bring you long-term focused analysis driven by fundamental data. Note that our analysis may not factor in the latest price-sensitive company announcements or qualitative material. Simply Wall St has no position in any stocks mentioned.
About CNSX:VST
Victory Square Technologies
A private equity and venture capital firm specializing in incubation, acquisition and invests in startups, Early stage and provides the senior leadership and resources needed to growth.
Low risk with questionable track record.
Similar Companies
Market Insights

Advertisement
Community Narratives
MicroVision will explode future revenue by 380.37% with a vision towards success
Fair Value US$60|98.4% undervalued
TH
Community Contributor
The Indispensable Artery for a New North American Economy
Fair Value CA$132.87|1.6% undervalued
TI
Community Contributor
Recently Updated Narratives
BE


Bejgal on MINISO Group Holding ·
MINISO's fair value is projected at 26.69 with an anticipated PE ratio shift of 20x
Fair Value:US$26.6928.0% undervalued
44 followersusers have followed this narrative
3 commentsusers have commented on this narrative
0 likesusers have liked this narrative
TI


TickerTickle on Oracle ·
The Quiet Giant That Became AI’s Power Grid
Fair Value:US$389.8149.5% undervalued
7 followersusers have followed this narrative
1 commentusers have commented on this narrative
0 likesusers have liked this narrative
AU

AuCA on Nova Ljubljanska Banka d.d ·
Nova Ljubljanska Banka d.d will expect a 11.2% revenue boost driving future growth
Fair Value:€20916.5% undervalued
23 followersusers have followed this narrative
3 commentsusers have commented on this narrative
0 likesusers have liked this narrative
Popular Narratives
OS


oscargarcia on Alphabet ·
The company that turned a verb into a global necessity and basically runs the modern internet, digital ads, smartphones, maps, and AI.
Fair Value:US$3404.9% undervalued
135 followersusers have followed this narrative
6 commentsusers have commented on this narrative
18 likesusers have liked this narrative
TH

TheWallstreetKing on MicroVision ·
MicroVision will explode future revenue by 380.37% with a vision towards success
Fair Value:US$6098.4% undervalued
87 followersusers have followed this narrative
11 commentsusers have commented on this narrative
18 likesusers have liked this narrative
AN


AnalystConsensusTarget on NVIDIA ·
NVDA: Expanding AI Demand Will Drive Major Data Center Investments Through 2026
Fair Value:US$232.7923.6% undervalued
924 followersusers have followed this narrative
5 commentsusers have commented on this narrative
22 likesusers have liked this narrative