
Advertisement
iFabric Corp.'s (TSE:IFA) Financials Are Too Obscure To Link With Current Share Price Momentum: What's In Store For the Stock?
Most readers would already be aware that iFabric's (TSE:IFA) stock increased significantly by 55% over the past three months. However, we decided to pay attention to the company's fundamentals which don't appear to give a clear sign about the company's financial health. In this article, we decided to focus on iFabric's ROE.
Return on Equity or ROE is a test of how effectively a company is growing its value and managing investors’ money. In simpler terms, it measures the profitability of a company in relation to shareholder's equity.
How To Calculate Return On Equity?
The formula for ROE is:
Return on Equity = Net Profit (from continuing operations) ÷ Shareholders' Equity
So, based on the above formula, the ROE for iFabric is:
4.4% = CA$917k ÷ CA$21m (Based on the trailing twelve months to June 2025).
The 'return' refers to a company's earnings over the last year. That means that for every CA$1 worth of shareholders' equity, the company generated CA$0.04 in profit.
Check out our latest analysis for iFabric
What Has ROE Got To Do With Earnings Growth?
We have already established that ROE serves as an efficient profit-generating gauge for a company's future earnings. Based on how much of its profits the company chooses to reinvest or "retain", we are then able to evaluate a company's future ability to generate profits. Generally speaking, other things being equal, firms with a high return on equity and profit retention, have a higher growth rate than firms that don’t share these attributes.
iFabric's Earnings Growth And 4.4% ROE
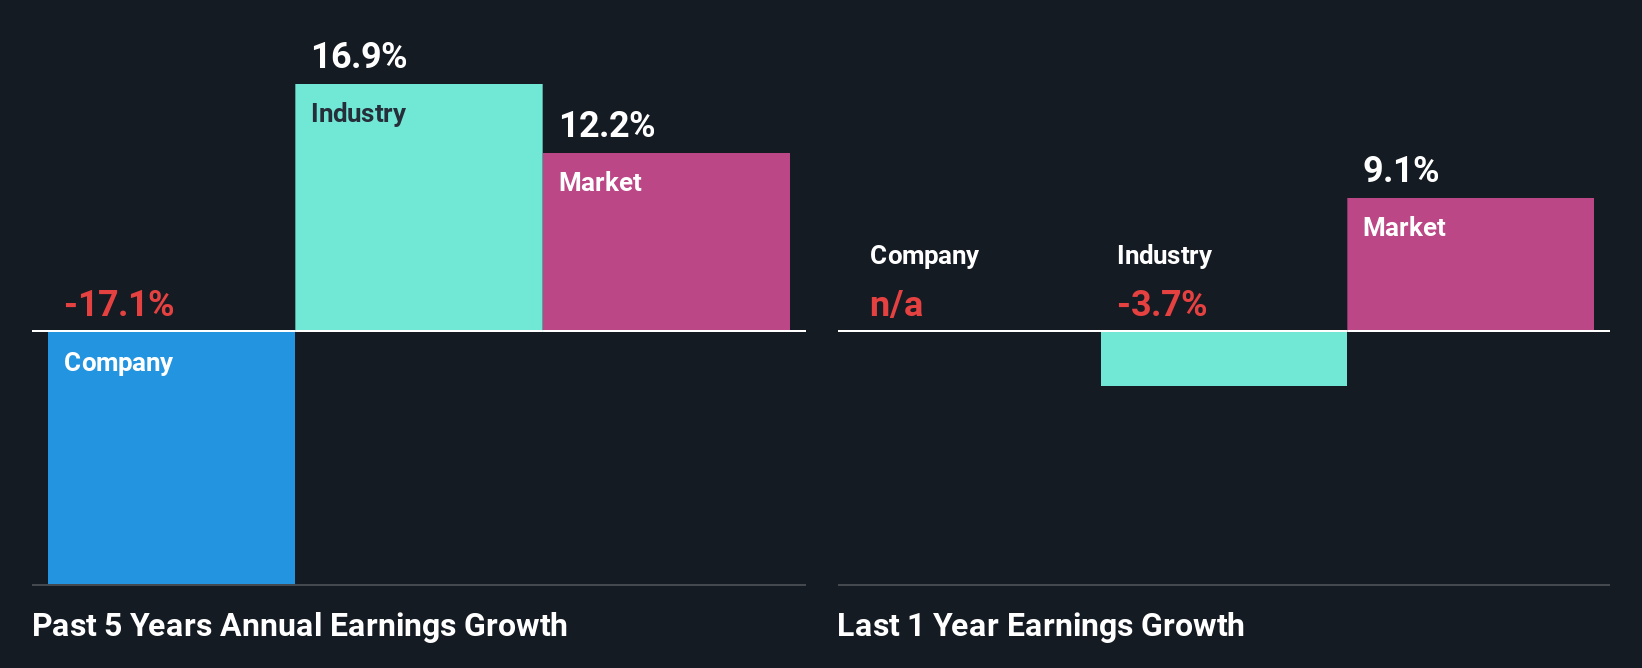
It is hard to argue that iFabric's ROE is much good in and of itself. Even when compared to the industry average of 12%, the ROE figure is pretty disappointing. Given the circumstances, the significant decline in net income by 17% seen by iFabric over the last five years is not surprising. We believe that there also might be other aspects that are negatively influencing the company's earnings prospects. Such as - low earnings retention or poor allocation of capital.
However, when we compared iFabric's growth with the industry we found that while the company's earnings have been shrinking, the industry has seen an earnings growth of 17% in the same period. This is quite worrisome.
Earnings growth is an important metric to consider when valuing a stock. The investor should try to establish if the expected growth or decline in earnings, whichever the case may be, is priced in. By doing so, they will have an idea if the stock is headed into clear blue waters or if swampy waters await. One good indicator of expected earnings growth is the P/E ratio which determines the price the market is willing to pay for a stock based on its earnings prospects. So, you may want to check if iFabric is trading on a high P/E or a low P/E, relative to its industry.
Is iFabric Efficiently Re-investing Its Profits?
iFabric doesn't pay any regular dividends, meaning that the company is keeping all of its profits, which makes us wonder why it is retaining its earnings if it can't use them to grow its business. It looks like there might be some other reasons to explain the lack in that respect. For example, the business could be in decline.
Summary
In total, we're a bit ambivalent about iFabric's performance. Even though it appears to be retaining most of its profits, given the low ROE, investors may not be benefitting from all that reinvestment after all. The low earnings growth suggests our theory correct. Wrapping up, we would proceed with caution with this company and one way of doing that would be to look at the risk profile of the business. You can see the 1 risk we have identified for iFabric by visiting our risks dashboard for free on our platform here.
Valuation is complex, but we're here to simplify it.
Discover if iFabric might be undervalued or overvalued with our detailed analysis, featuring fair value estimates, potential risks, dividends, insider trades, and its financial condition.
Access Free AnalysisHave feedback on this article? Concerned about the content? Get in touch with us directly. Alternatively, email editorial-team (at) simplywallst.com.
This article by Simply Wall St is general in nature. We provide commentary based on historical data and analyst forecasts only using an unbiased methodology and our articles are not intended to be financial advice. It does not constitute a recommendation to buy or sell any stock, and does not take account of your objectives, or your financial situation. We aim to bring you long-term focused analysis driven by fundamental data. Note that our analysis may not factor in the latest price-sensitive company announcements or qualitative material. Simply Wall St has no position in any stocks mentioned.
About TSX:IFA
iFabric
Engages in the design and distribute of women's intimate apparel and accessories in Canada, the United States, the United Kingdom, Southeast Asia, and internationally.
Excellent balance sheet with acceptable track record.
Market Insights

Advertisement
Community Narratives
The company that turned a verb into a global necessity and basically runs the modern internet, digital ads, smartphones, maps, and AI.
Fair Value US$300.00|6.3% undervalued
OS
Community Contributor
Flowers Foods Pays A Fair Price For Health
Fair Value US$16.12|26.0% undervalued
NV
Community Contributor
TMX Group will thrive with 33.3% profit margin and enduring market moat
Fair Value CA$49.90|3.7% overvalued
LI
Community Contributor