- Canada
- /
- Aerospace & Defense
- /
- TSX:CAE
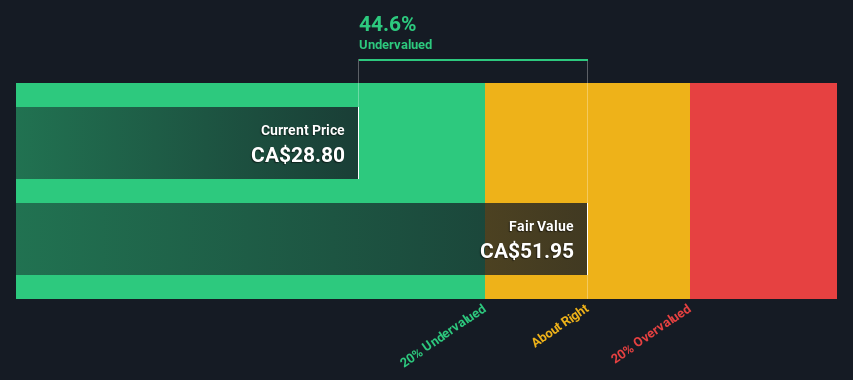
An Intrinsic Calculation For CAE Inc. (TSE:CAE) Suggests It's 45% Undervalued


Key Insights
- Using the 2 Stage Free Cash Flow to Equity, CAE fair value estimate is CA$51.95
- CAE is estimated to be 45% undervalued based on current share price of CA$28.80
- Analyst price target for CAE is CA$37.75 which is 27% below our fair value estimate
Does the October share price for CAE Inc. (TSE:CAE) reflect what it's really worth? Today, we will estimate the stock's intrinsic value by taking the expected future cash flows and discounting them to today's value. The Discounted Cash Flow (DCF) model is the tool we will apply to do this. Believe it or not, it's not too difficult to follow, as you'll see from our example!
Remember though, that there are many ways to estimate a company's value, and a DCF is just one method. If you still have some burning questions about this type of valuation, take a look at the Simply Wall St analysis model.
View our latest analysis for CAE
The Method
We are going to use a two-stage DCF model, which, as the name states, takes into account two stages of growth. The first stage is generally a higher growth period which levels off heading towards the terminal value, captured in the second 'steady growth' period. To begin with, we have to get estimates of the next ten years of cash flows. Where possible we use analyst estimates, but when these aren't available we extrapolate the previous free cash flow (FCF) from the last estimate or reported value. We assume companies with shrinking free cash flow will slow their rate of shrinkage, and that companies with growing free cash flow will see their growth rate slow, over this period. We do this to reflect that growth tends to slow more in the early years than it does in later years.
Generally we assume that a dollar today is more valuable than a dollar in the future, and so the sum of these future cash flows is then discounted to today's value:
10-year free cash flow (FCF) estimate
| 2024 | 2025 | 2026 | 2027 | 2028 | 2029 | 2030 | 2031 | 2032 | 2033 | |
| Levered FCF (CA$, Millions) | CA$345.3m | CA$511.8m | CA$611.5m | CA$684.9m | CA$746.3m | CA$797.2m | CA$839.8m | CA$875.9m | CA$907.1m | CA$934.8m |
| Growth Rate Estimate Source | Analyst x5 | Analyst x4 | Analyst x2 | Est @ 12.00% | Est @ 8.96% | Est @ 6.83% | Est @ 5.34% | Est @ 4.30% | Est @ 3.56% | Est @ 3.05% |
| Present Value (CA$, Millions) Discounted @ 6.3% | CA$325 | CA$453 | CA$509 | CA$536 | CA$549 | CA$551 | CA$546 | CA$536 | CA$522 | CA$506 |
("Est" = FCF growth rate estimated by Simply Wall St)
Present Value of 10-year Cash Flow (PVCF) = CA$5.0b
The second stage is also known as Terminal Value, this is the business's cash flow after the first stage. For a number of reasons a very conservative growth rate is used that cannot exceed that of a country's GDP growth. In this case we have used the 5-year average of the 10-year government bond yield (1.9%) to estimate future growth. In the same way as with the 10-year 'growth' period, we discount future cash flows to today's value, using a cost of equity of 6.3%.
Terminal Value (TV)= FCF2033 × (1 + g) ÷ (r – g) = CA$935m× (1 + 1.9%) ÷ (6.3%– 1.9%) = CA$21b
Present Value of Terminal Value (PVTV)= TV / (1 + r)10= CA$21b÷ ( 1 + 6.3%)10= CA$12b
The total value, or equity value, is then the sum of the present value of the future cash flows, which in this case is CA$17b. The last step is to then divide the equity value by the number of shares outstanding. Compared to the current share price of CA$28.8, the company appears quite undervalued at a 45% discount to where the stock price trades currently. Remember though, that this is just an approximate valuation, and like any complex formula - garbage in, garbage out.
Important Assumptions
We would point out that the most important inputs to a discounted cash flow are the discount rate and of course the actual cash flows. You don't have to agree with these inputs, I recommend redoing the calculations yourself and playing with them. The DCF also does not consider the possible cyclicality of an industry, or a company's future capital requirements, so it does not give a full picture of a company's potential performance. Given that we are looking at CAE as potential shareholders, the cost of equity is used as the discount rate, rather than the cost of capital (or weighted average cost of capital, WACC) which accounts for debt. In this calculation we've used 6.3%, which is based on a levered beta of 0.896. Beta is a measure of a stock's volatility, compared to the market as a whole. We get our beta from the industry average beta of globally comparable companies, with an imposed limit between 0.8 and 2.0, which is a reasonable range for a stable business.
SWOT Analysis for CAE
- Earnings growth over the past year exceeded the industry.
- Debt is well covered by earnings.
- No major weaknesses identified for CAE.
- Annual earnings are forecast to grow faster than the Canadian market.
- Trading below our estimate of fair value by more than 20%.
- Debt is not well covered by operating cash flow.
- Revenue is forecast to grow slower than 20% per year.
Looking Ahead:
Valuation is only one side of the coin in terms of building your investment thesis, and it shouldn't be the only metric you look at when researching a company. It's not possible to obtain a foolproof valuation with a DCF model. Rather it should be seen as a guide to "what assumptions need to be true for this stock to be under/overvalued?" For example, changes in the company's cost of equity or the risk free rate can significantly impact the valuation. Why is the intrinsic value higher than the current share price? For CAE, we've put together three further elements you should consider:
- Risks: Case in point, we've spotted 1 warning sign for CAE you should be aware of.
- Future Earnings: How does CAE's growth rate compare to its peers and the wider market? Dig deeper into the analyst consensus number for the upcoming years by interacting with our free analyst growth expectation chart.
- Other Solid Businesses: Low debt, high returns on equity and good past performance are fundamental to a strong business. Why not explore our interactive list of stocks with solid business fundamentals to see if there are other companies you may not have considered!
PS. Simply Wall St updates its DCF calculation for every Canadian stock every day, so if you want to find the intrinsic value of any other stock just search here.
New: AI Stock Screener & Alerts
Our new AI Stock Screener scans the market every day to uncover opportunities.
• Dividend Powerhouses (3%+ Yield)
• Undervalued Small Caps with Insider Buying
• High growth Tech and AI Companies
Or build your own from over 50 metrics.
Have feedback on this article? Concerned about the content? Get in touch with us directly. Alternatively, email editorial-team (at) simplywallst.com.
This article by Simply Wall St is general in nature. We provide commentary based on historical data and analyst forecasts only using an unbiased methodology and our articles are not intended to be financial advice. It does not constitute a recommendation to buy or sell any stock, and does not take account of your objectives, or your financial situation. We aim to bring you long-term focused analysis driven by fundamental data. Note that our analysis may not factor in the latest price-sensitive company announcements or qualitative material. Simply Wall St has no position in any stocks mentioned.
About TSX:CAE
CAE
Provides simulation training and critical operations support solutions in Canada, the United States, the United Kingdom, Europe, Asia, the Oceania, Africa, and Rest of the Americas.
Fair value with moderate growth potential.

