
Advertisement
- Canada
- /
- Construction
- /
- TSX:ARE
This Is Why Aecon Group Inc.'s (TSE:ARE) CEO Compensation Looks Appropriate
Key Insights
- Aecon Group to hold its Annual General Meeting on 4th of June
- Salary of CA$1.06m is part of CEO Jean-Louis Servranckx's total remuneration
- Total compensation is similar to the industry average
- Aecon Group's total shareholder return over the past three years was 5.9% while its EPS grew by 25% over the past three years
CEO Jean-Louis Servranckx has done a decent job of delivering relatively good performance at Aecon Group Inc. (TSE:ARE) recently. In light of this performance, CEO compensation will probably not be the main focus for shareholders as they go into the AGM on 4th of June. We present our case of why we think CEO compensation looks fair.
Check out our latest analysis for Aecon Group
How Does Total Compensation For Jean-Louis Servranckx Compare With Other Companies In The Industry?
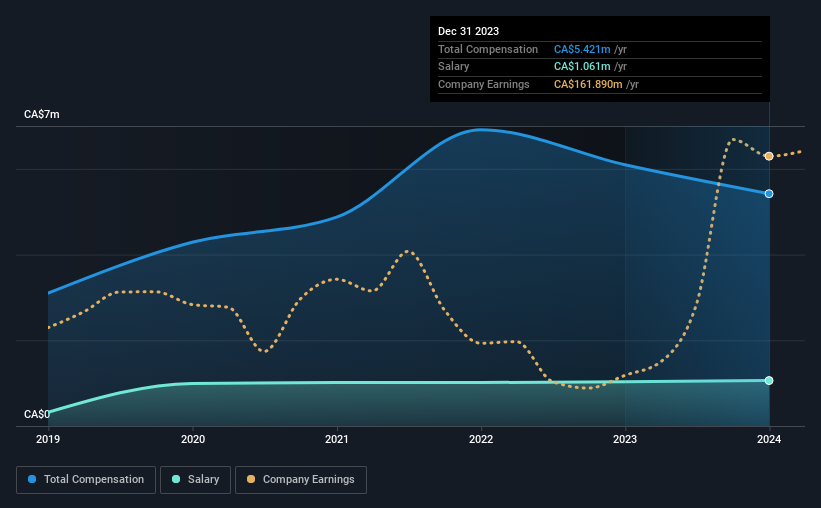
Our data indicates that Aecon Group Inc. has a market capitalization of CA$1.1b, and total annual CEO compensation was reported as CA$5.4m for the year to December 2023. Notably, that's a decrease of 11% over the year before. While this analysis focuses on total compensation, it's worth acknowledging that the salary portion is lower, valued at CA$1.1m.
In comparison with other companies in the Canadian Construction industry with market capitalizations ranging from CA$546m to CA$2.2b, the reported median CEO total compensation was CA$4.3m. From this we gather that Jean-Louis Servranckx is paid around the median for CEOs in the industry. What's more, Jean-Louis Servranckx holds CA$91k worth of shares in the company in their own name.
| Component | 2023 | 2022 | Proportion (2023) |
| Salary | CA$1.1m | CA$1.0m | 20% |
| Other | CA$4.4m | CA$5.1m | 80% |
| Total Compensation | CA$5.4m | CA$6.1m | 100% |
Speaking on an industry level, nearly 20% of total compensation represents salary, while the remainder of 80% is other remuneration. Although there is a difference in how total compensation is set, Aecon Group more or less reflects the market in terms of setting the salary. It's important to note that a slant towards non-salary compensation suggests that total pay is tied to the company's performance.
Aecon Group Inc.'s Growth
Over the past three years, Aecon Group Inc. has seen its earnings per share (EPS) grow by 25% per year. In the last year, its revenue is down 9.0%.
Overall this is a positive result for shareholders, showing that the company has improved in recent years. While it would be good to see revenue growth, profits matter more in the end. Historical performance can sometimes be a good indicator on what's coming up next but if you want to peer into the company's future you might be interested in this free visualization of analyst forecasts.
Has Aecon Group Inc. Been A Good Investment?
With a total shareholder return of 5.9% over three years, Aecon Group Inc. has done okay by shareholders, but there's always room for improvement. In light of that, investors might probably want to see an improvement on their returns before they feel generous about increasing the CEO remuneration.
To Conclude...
Seeing that the company has put up a decent performance, only a few shareholders, if any at all, might have questions about the CEO pay in the upcoming AGM. Despite the pleasing results, we still think that any proposed increases to CEO compensation will be examined based on a case by case basis and linked to performance outcomes.
We can learn a lot about a company by studying its CEO compensation trends, along with looking at other aspects of the business. In our study, we found 3 warning signs for Aecon Group you should be aware of, and 1 of them is concerning.
Of course, you might find a fantastic investment by looking at a different set of stocks. So take a peek at this free list of interesting companies.
New: Manage All Your Stock Portfolios in One Place
We've created the ultimate portfolio companion for stock investors, and it's free.
• Connect an unlimited number of Portfolios and see your total in one currency
• Be alerted to new Warning Signs or Risks via email or mobile
• Track the Fair Value of your stocks
Have feedback on this article? Concerned about the content? Get in touch with us directly. Alternatively, email editorial-team (at) simplywallst.com.
This article by Simply Wall St is general in nature. We provide commentary based on historical data and analyst forecasts only using an unbiased methodology and our articles are not intended to be financial advice. It does not constitute a recommendation to buy or sell any stock, and does not take account of your objectives, or your financial situation. We aim to bring you long-term focused analysis driven by fundamental data. Note that our analysis may not factor in the latest price-sensitive company announcements or qualitative material. Simply Wall St has no position in any stocks mentioned.
About TSX:ARE
Aecon Group
Aecon Group Inc., together with its subsidiaries, provide construction and infrastructure development services to private and public sector clients in Canada, the United States, and internationally.
Very undervalued with reasonable growth potential.
Similar Companies
Market Insights

Advertisement
Community Narratives
MicroVision will explode future revenue by 380.37% with a vision towards success
Fair Value US$60.00|98.4% undervalued
TH
Community Contributor
The Indispensable Artery for a New North American Economy
Fair Value CA$132.87|1.3% undervalued
TI
Community Contributor