
Advertisement
- Brazil
- /
- Electric Utilities
- /
- BOVESPA:CBEE3
Even With A 104% Surge, Cautious Investors Are Not Rewarding Ampla Energia e Serviços S.A.'s (BVMF:CBEE3) Performance Completely
The Ampla Energia e Serviços S.A. (BVMF:CBEE3) share price has done very well over the last month, posting an excellent gain of 104%. Longer-term shareholders would be thankful for the recovery in the share price since it's now virtually flat for the year after the recent bounce.
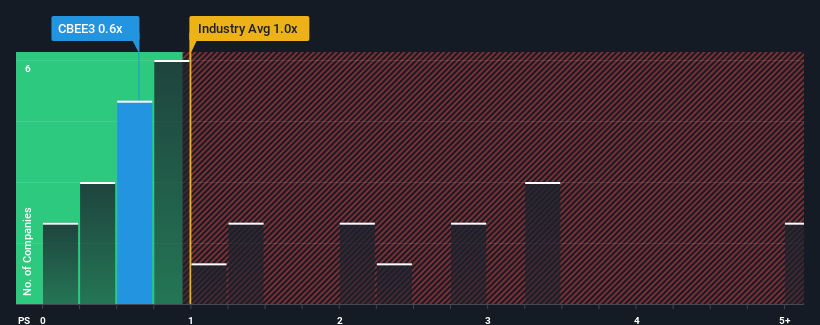
In spite of the firm bounce in price, you could still be forgiven for feeling indifferent about Ampla Energia e Serviços' P/S ratio of 0.6x, since the median price-to-sales (or "P/S") ratio for the Electric Utilities industry in Brazil is also close to 1x. While this might not raise any eyebrows, if the P/S ratio is not justified investors could be missing out on a potential opportunity or ignoring looming disappointment.
View our latest analysis for Ampla Energia e Serviços
What Does Ampla Energia e Serviços' P/S Mean For Shareholders?
It looks like revenue growth has deserted Ampla Energia e Serviços recently, which is not something to boast about. It might be that many expect the uninspiring revenue performance to only match most other companies at best over the coming period, which has kept the P/S from rising. If not, then existing shareholders may be feeling hopeful about the future direction of the share price.
Although there are no analyst estimates available for Ampla Energia e Serviços, take a look at this free data-rich visualisation to see how the company stacks up on earnings, revenue and cash flow.How Is Ampla Energia e Serviços' Revenue Growth Trending?
In order to justify its P/S ratio, Ampla Energia e Serviços would need to produce growth that's similar to the industry.
Taking a look back first, we see that there was hardly any revenue growth to speak of for the company over the past year. Still, the latest three year period was better as it's delivered a decent 9.8% overall rise in revenue. Accordingly, shareholders probably wouldn't have been overly satisfied with the unstable medium-term growth rates.
Weighing the recent medium-term upward revenue trajectory against the broader industry's one-year forecast for contraction of 2.7% shows it's a great look while it lasts.
With this in mind, we find it intriguing that Ampla Energia e Serviços' P/S matches its industry peers. It looks like most investors are not convinced the company can maintain its recent positive growth rate in the face of a shrinking broader industry.
The Final Word
Its shares have lifted substantially and now Ampla Energia e Serviços' P/S is back within range of the industry median. Using the price-to-sales ratio alone to determine if you should sell your stock isn't sensible, however it can be a practical guide to the company's future prospects.
As mentioned previously, Ampla Energia e Serviços currently trades on a P/S on par with the wider industry, but this is lower than expected considering its recent three-year revenue growth is beating forecasts for a struggling industry. There could be some unobserved threats to revenue preventing the P/S ratio from outpacing the industry much like its revenue performance. Perhaps there is some hesitation about the company's ability to stay its recent course and swim against the current of the broader industry turmoil. The fact that the company's relative performance has not provided a kick to the share price suggests that some investors are anticipating revenue instability.
Plus, you should also learn about these 3 warning signs we've spotted with Ampla Energia e Serviços.
If strong companies turning a profit tickle your fancy, then you'll want to check out this free list of interesting companies that trade on a low P/E (but have proven they can grow earnings).
New: Manage All Your Stock Portfolios in One Place
We've created the ultimate portfolio companion for stock investors, and it's free.
• Connect an unlimited number of Portfolios and see your total in one currency
• Be alerted to new Warning Signs or Risks via email or mobile
• Track the Fair Value of your stocks
Have feedback on this article? Concerned about the content? Get in touch with us directly. Alternatively, email editorial-team (at) simplywallst.com.
This article by Simply Wall St is general in nature. We provide commentary based on historical data and analyst forecasts only using an unbiased methodology and our articles are not intended to be financial advice. It does not constitute a recommendation to buy or sell any stock, and does not take account of your objectives, or your financial situation. We aim to bring you long-term focused analysis driven by fundamental data. Note that our analysis may not factor in the latest price-sensitive company announcements or qualitative material. Simply Wall St has no position in any stocks mentioned.
About BOVESPA:CBEE3
Ampla Energia e Serviços
Ampla Energia e Serviços S.A. is involved in the distribution of electricity in Brazil.
Moderate risk second-rate dividend payer.
Market Insights

Advertisement
Community Narratives
The "Molecular Pencil": Why Beam's Technology is Built to Win
Fair Value US$65.01|65.4% undervalued
DA
Community Contributor
The silent giant behind virtually every advanced chip powering AI, smartphones, and modern infrastructure.
Fair Value US$310.00|6.1% undervalued
OS
Community Contributor
ADP Stock: Solid Fundamentals, But AI Investments Test Its Margin Resilience
Fair Value US$387.77|34.2% undervalued
YI
Community Contributor
MINISO's fair value is projected at 26.69 with an anticipated PE ratio shift of 20x
Fair Value US$24.03|9.6% undervalued
BE
Community Contributor