Stock Analysis
- Brazil
- /
- Healthcare Services
- /
- BOVESPA:PFRM3
Returns On Capital Are Showing Encouraging Signs At Profarma Distribuidora de Produtos Farmacêuticos (BVMF:PFRM3)


Did you know there are some financial metrics that can provide clues of a potential multi-bagger? Firstly, we'll want to see a proven return on capital employed (ROCE) that is increasing, and secondly, an expanding base of capital employed. Put simply, these types of businesses are compounding machines, meaning they are continually reinvesting their earnings at ever-higher rates of return. So when we looked at Profarma Distribuidora de Produtos Farmacêuticos (BVMF:PFRM3) and its trend of ROCE, we really liked what we saw.
Understanding Return On Capital Employed (ROCE)
Just to clarify if you're unsure, ROCE is a metric for evaluating how much pre-tax income (in percentage terms) a company earns on the capital invested in its business. To calculate this metric for Profarma Distribuidora de Produtos Farmacêuticos, this is the formula:
Return on Capital Employed = Earnings Before Interest and Tax (EBIT) ÷ (Total Assets - Current Liabilities)
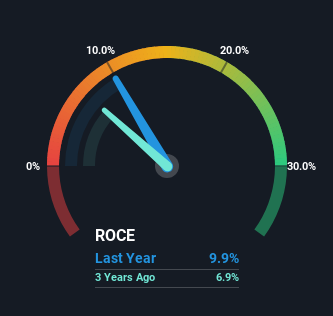
0.099 = R$228m ÷ (R$4.6b - R$2.3b) (Based on the trailing twelve months to June 2023).
Therefore, Profarma Distribuidora de Produtos Farmacêuticos has an ROCE of 9.9%. On its own that's a low return on capital but it's in line with the industry's average returns of 10.0%.
Check out our latest analysis for Profarma Distribuidora de Produtos Farmacêuticos
While the past is not representative of the future, it can be helpful to know how a company has performed historically, which is why we have this chart above. If you'd like to look at how Profarma Distribuidora de Produtos Farmacêuticos has performed in the past in other metrics, you can view this free graph of past earnings, revenue and cash flow.
What Does the ROCE Trend For Profarma Distribuidora de Produtos Farmacêuticos Tell Us?
Even though ROCE is still low in absolute terms, it's good to see it's heading in the right direction. The numbers show that in the last five years, the returns generated on capital employed have grown considerably to 9.9%. The company is effectively making more money per dollar of capital used, and it's worth noting that the amount of capital has increased too, by 68%. This can indicate that there's plenty of opportunities to invest capital internally and at ever higher rates, a combination that's common among multi-baggers.
Another thing to note, Profarma Distribuidora de Produtos Farmacêuticos has a high ratio of current liabilities to total assets of 50%. This effectively means that suppliers (or short-term creditors) are funding a large portion of the business, so just be aware that this can introduce some elements of risk. While it's not necessarily a bad thing, it can be beneficial if this ratio is lower.
The Bottom Line On Profarma Distribuidora de Produtos Farmacêuticos' ROCE
In summary, it's great to see that Profarma Distribuidora de Produtos Farmacêuticos can compound returns by consistently reinvesting capital at increasing rates of return, because these are some of the key ingredients of those highly sought after multi-baggers. And since the stock has fallen 14% over the last five years, there might be an opportunity here. That being the case, research into the company's current valuation metrics and future prospects seems fitting.
If you'd like to know more about Profarma Distribuidora de Produtos Farmacêuticos, we've spotted 5 warning signs, and 1 of them shouldn't be ignored.
For those who like to invest in solid companies, check out this free list of companies with solid balance sheets and high returns on equity.
Valuation is complex, but we're helping make it simple.
Find out whether Profarma Distribuidora de Produtos Farmacêuticos is potentially over or undervalued by checking out our comprehensive analysis, which includes fair value estimates, risks and warnings, dividends, insider transactions and financial health.
View the Free AnalysisHave feedback on this article? Concerned about the content? Get in touch with us directly. Alternatively, email editorial-team (at) simplywallst.com.
This article by Simply Wall St is general in nature. We provide commentary based on historical data and analyst forecasts only using an unbiased methodology and our articles are not intended to be financial advice. It does not constitute a recommendation to buy or sell any stock, and does not take account of your objectives, or your financial situation. We aim to bring you long-term focused analysis driven by fundamental data. Note that our analysis may not factor in the latest price-sensitive company announcements or qualitative material. Simply Wall St has no position in any stocks mentioned.
About BOVESPA:PFRM3
Profarma Distribuidora de Produtos Farmacêuticos
Profarma Distribuidora de Produtos Farmacêuticos S.A., together with its subsidiaries, engages in the distribution and retail sale of pharmaceutical products in Brazil.
Excellent balance sheet and slightly overvalued.
