
Advertisement
- Brazil
- /
- Capital Markets
- /
- BOVESPA:TRAD3
The Price Is Right For TC Traders Club S.A. (BVMF:TRAD3) Even After Diving 25%
Unfortunately for some shareholders, the TC Traders Club S.A. (BVMF:TRAD3) share price has dived 25% in the last thirty days, prolonging recent pain. The recent drop completes a disastrous twelve months for shareholders, who are sitting on a 63% loss during that time.
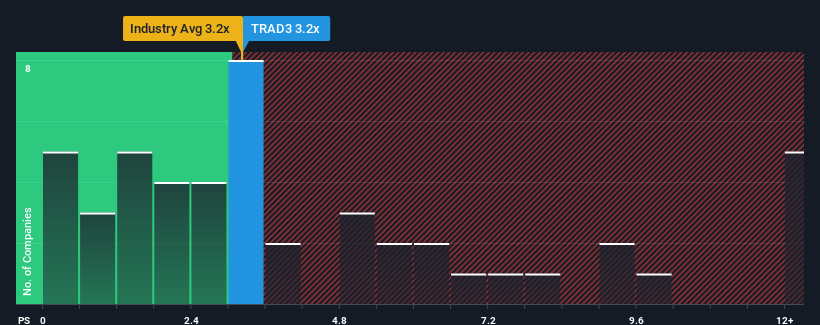
Although its price has dipped substantially, it's still not a stretch to say that TC Traders Club's price-to-sales (or "P/S") ratio of 3.2x right now seems quite "middle-of-the-road" compared to the Capital Markets industry in Brazil, where the median P/S ratio is around 3.1x. Although, it's not wise to simply ignore the P/S without explanation as investors may be disregarding a distinct opportunity or a costly mistake.
Check out our latest analysis for TC Traders Club
How Has TC Traders Club Performed Recently?
As an illustration, revenue has deteriorated at TC Traders Club over the last year, which is not ideal at all. Perhaps investors believe the recent revenue performance is enough to keep in line with the industry, which is keeping the P/S from dropping off. If not, then existing shareholders may be a little nervous about the viability of the share price.
Although there are no analyst estimates available for TC Traders Club, take a look at this free data-rich visualisation to see how the company stacks up on earnings, revenue and cash flow.How Is TC Traders Club's Revenue Growth Trending?
The only time you'd be comfortable seeing a P/S like TC Traders Club's is when the company's growth is tracking the industry closely.
Taking a look back first, the company's revenue growth last year wasn't something to get excited about as it posted a disappointing decline of 41%. However, a few very strong years before that means that it was still able to grow revenue by an impressive 41% in total over the last three years. Although it's been a bumpy ride, it's still fair to say the revenue growth recently has been more than adequate for the company.
Weighing that recent medium-term revenue trajectory against the broader industry's one-year forecast for expansion of 11% shows it's about the same on an annualised basis.
In light of this, it's understandable that TC Traders Club's P/S sits in line with the majority of other companies. Apparently shareholders are comfortable to simply hold on assuming the company will continue keeping a low profile.
What Does TC Traders Club's P/S Mean For Investors?
Following TC Traders Club's share price tumble, its P/S is just clinging on to the industry median P/S. We'd say the price-to-sales ratio's power isn't primarily as a valuation instrument but rather to gauge current investor sentiment and future expectations.
As we've seen, TC Traders Club's three-year revenue trends seem to be contributing to its P/S, given they look similar to current industry expectations. With previous revenue trends that keep up with the current industry outlook, it's hard to justify the company's P/S ratio deviating much from it's current point. If recent medium-term revenue trends continue, it's hard to see the share price moving strongly in either direction in the near future under these circumstances.
And what about other risks? Every company has them, and we've spotted 3 warning signs for TC Traders Club (of which 2 don't sit too well with us!) you should know about.
Of course, profitable companies with a history of great earnings growth are generally safer bets. So you may wish to see this free collection of other companies that have reasonable P/E ratios and have grown earnings strongly.
Valuation is complex, but we're here to simplify it.
Discover if TC might be undervalued or overvalued with our detailed analysis, featuring fair value estimates, potential risks, dividends, insider trades, and its financial condition.
Access Free AnalysisHave feedback on this article? Concerned about the content? Get in touch with us directly. Alternatively, email editorial-team (at) simplywallst.com.
This article by Simply Wall St is general in nature. We provide commentary based on historical data and analyst forecasts only using an unbiased methodology and our articles are not intended to be financial advice. It does not constitute a recommendation to buy or sell any stock, and does not take account of your objectives, or your financial situation. We aim to bring you long-term focused analysis driven by fundamental data. Note that our analysis may not factor in the latest price-sensitive company announcements or qualitative material. Simply Wall St has no position in any stocks mentioned.
About BOVESPA:TRAD3
TC
Operates an investor community. The company’s platform offers market intelligence including analysis, production of news and information for users, investment ideas, and sell side reports.
Adequate balance sheet with slight risk.
Market Insights

Advertisement
Community Narratives
MicroVision will explode future revenue by 380.37% with a vision towards success
Fair Value US$60.00|98.4% undervalued
TH
Community Contributor
The Indispensable Artery for a New North American Economy
Fair Value CA$132.87|1.3% undervalued
TI
Community Contributor