
Advertisement
- Bulgaria
- /
- Electric Utilities
- /
- BUL:TPLR
A Look At The Intrinsic Value Of Toplofikatsia-Ruse AD (BUL:TPLR)
Key Insights
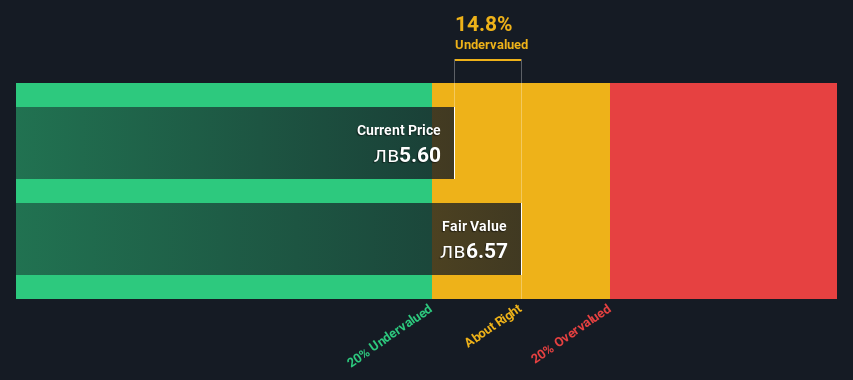
- The projected fair value for Toplofikatsia-Ruse AD is лв6.57 based on 2 Stage Free Cash Flow to Equity
- Current share price of лв5.60 suggests Toplofikatsia-Ruse AD is potentially trading close to its fair value
In this article we are going to estimate the intrinsic value of Toplofikatsia-Ruse AD (BUL:TPLR) by estimating the company's future cash flows and discounting them to their present value. This will be done using the Discounted Cash Flow (DCF) model. Before you think you won't be able to understand it, just read on! It's actually much less complex than you'd imagine.
We generally believe that a company's value is the present value of all of the cash it will generate in the future. However, a DCF is just one valuation metric among many, and it is not without flaws. If you want to learn more about discounted cash flow, the rationale behind this calculation can be read in detail in the Simply Wall St analysis model.
Check out our latest analysis for Toplofikatsia-Ruse AD
Crunching The Numbers
We use what is known as a 2-stage model, which simply means we have two different periods of growth rates for the company's cash flows. Generally the first stage is higher growth, and the second stage is a lower growth phase. To start off with, we need to estimate the next ten years of cash flows. Seeing as no analyst estimates of free cash flow are available to us, we have extrapolate the previous free cash flow (FCF) from the company's last reported value. We assume companies with shrinking free cash flow will slow their rate of shrinkage, and that companies with growing free cash flow will see their growth rate slow, over this period. We do this to reflect that growth tends to slow more in the early years than it does in later years.
A DCF is all about the idea that a dollar in the future is less valuable than a dollar today, and so the sum of these future cash flows is then discounted to today's value:
10-year free cash flow (FCF) estimate
| 2025 | 2026 | 2027 | 2028 | 2029 | 2030 | 2031 | 2032 | 2033 | 2034 | |
| Levered FCF (BGN, Millions) | лв9.00m | лв9.29m | лв9.58m | лв9.88m | лв10.2m | лв10.5m | лв10.8m | лв11.1m | лв11.5m | лв11.8m |
| Growth Rate Estimate Source | Est @ 3.31% | Est @ 3.22% | Est @ 3.16% | Est @ 3.11% | Est @ 3.08% | Est @ 3.06% | Est @ 3.05% | Est @ 3.03% | Est @ 3.03% | Est @ 3.02% |
| Present Value (BGN, Millions) Discounted @ 7.9% | лв8.3 | лв8.0 | лв7.6 | лв7.3 | лв7.0 | лв6.7 | лв6.4 | лв6.1 | лв5.8 | лв5.5 |
("Est" = FCF growth rate estimated by Simply Wall St)
Present Value of 10-year Cash Flow (PVCF) = лв69m
The second stage is also known as Terminal Value, this is the business's cash flow after the first stage. For a number of reasons a very conservative growth rate is used that cannot exceed that of a country's GDP growth. In this case we have used the 5-year average of the 10-year government bond yield (3.0%) to estimate future growth. In the same way as with the 10-year 'growth' period, we discount future cash flows to today's value, using a cost of equity of 7.9%.
Terminal Value (TV)= FCF2034 × (1 + g) ÷ (r – g) = лв12m× (1 + 3.0%) ÷ (7.9%– 3.0%) = лв251m
Present Value of Terminal Value (PVTV)= TV / (1 + r)10= лв251m÷ ( 1 + 7.9%)10= лв118m
The total value is the sum of cash flows for the next ten years plus the discounted terminal value, which results in the Total Equity Value, which in this case is лв186m. In the final step we divide the equity value by the number of shares outstanding. Compared to the current share price of лв5.6, the company appears about fair value at a 15% discount to where the stock price trades currently. Remember though, that this is just an approximate valuation, and like any complex formula - garbage in, garbage out.
The Assumptions
We would point out that the most important inputs to a discounted cash flow are the discount rate and of course the actual cash flows. If you don't agree with these result, have a go at the calculation yourself and play with the assumptions. The DCF also does not consider the possible cyclicality of an industry, or a company's future capital requirements, so it does not give a full picture of a company's potential performance. Given that we are looking at Toplofikatsia-Ruse AD as potential shareholders, the cost of equity is used as the discount rate, rather than the cost of capital (or weighted average cost of capital, WACC) which accounts for debt. In this calculation we've used 7.9%, which is based on a levered beta of 0.800. Beta is a measure of a stock's volatility, compared to the market as a whole. We get our beta from the industry average beta of globally comparable companies, with an imposed limit between 0.8 and 2.0, which is a reasonable range for a stable business.
Looking Ahead:
Whilst important, the DCF calculation shouldn't be the only metric you look at when researching a company. DCF models are not the be-all and end-all of investment valuation. Rather it should be seen as a guide to "what assumptions need to be true for this stock to be under/overvalued?" For instance, if the terminal value growth rate is adjusted slightly, it can dramatically alter the overall result. For Toplofikatsia-Ruse AD, we've put together three further factors you should further examine:
- Risks: Consider for instance, the ever-present spectre of investment risk. We've identified 3 warning signs with Toplofikatsia-Ruse AD (at least 2 which don't sit too well with us) , and understanding these should be part of your investment process.
- Other Solid Businesses: Low debt, high returns on equity and good past performance are fundamental to a strong business. Why not explore our interactive list of stocks with solid business fundamentals to see if there are other companies you may not have considered!
- Other Top Analyst Picks: Interested to see what the analysts are thinking? Take a look at our interactive list of analysts' top stock picks to find out what they feel might have an attractive future outlook!
PS. Simply Wall St updates its DCF calculation for every Bulgarian stock every day, so if you want to find the intrinsic value of any other stock just search here.
Valuation is complex, but we're here to simplify it.
Discover if Toplofikatsia-Ruse AD might be undervalued or overvalued with our detailed analysis, featuring fair value estimates, potential risks, dividends, insider trades, and its financial condition.
Access Free AnalysisHave feedback on this article? Concerned about the content? Get in touch with us directly. Alternatively, email editorial-team (at) simplywallst.com.
This article by Simply Wall St is general in nature. We provide commentary based on historical data and analyst forecasts only using an unbiased methodology and our articles are not intended to be financial advice. It does not constitute a recommendation to buy or sell any stock, and does not take account of your objectives, or your financial situation. We aim to bring you long-term focused analysis driven by fundamental data. Note that our analysis may not factor in the latest price-sensitive company announcements or qualitative material. Simply Wall St has no position in any stocks mentioned.
About BUL:TPLR
Toplofikatsia-Ruse AD
Produces and sells electricity and thermal energy in Bulgaria.
Good value with adequate balance sheet.
Market Insights

Advertisement
Community Narratives
The company that turned a verb into a global necessity and basically runs the modern internet, digital ads, smartphones, maps, and AI.
Fair Value US$300.00|6.2% undervalued
OS
Community Contributor
Flowers Foods Pays A Fair Price For Health
Fair Value US$16.12|25.1% undervalued
NV
Community Contributor
TMX Group will thrive with 33.3% profit margin and enduring market moat
Fair Value CA$49.90|0.04% overvalued
LI
Community Contributor