- Belgium
- /
- Telecom Services and Carriers
- /
- ENXTBR:PROX
Proximus (EBR:PROX) earnings and shareholder returns have been trending downwards for the last five years, but the stock grows 3.2% this past week


We think intelligent long term investing is the way to go. But along the way some stocks are going to perform badly. Zooming in on an example, the Proximus PLC (EBR:PROX) share price dropped 73% in the last half decade. That is extremely sub-optimal, to say the least. In contrast, the stock price has popped 8.1% in the last thirty days.
The recent uptick of 3.2% could be a positive sign of things to come, so let's take a look at historical fundamentals.
View our latest analysis for Proximus
While the efficient markets hypothesis continues to be taught by some, it has been proven that markets are over-reactive dynamic systems, and investors are not always rational. One flawed but reasonable way to assess how sentiment around a company has changed is to compare the earnings per share (EPS) with the share price.
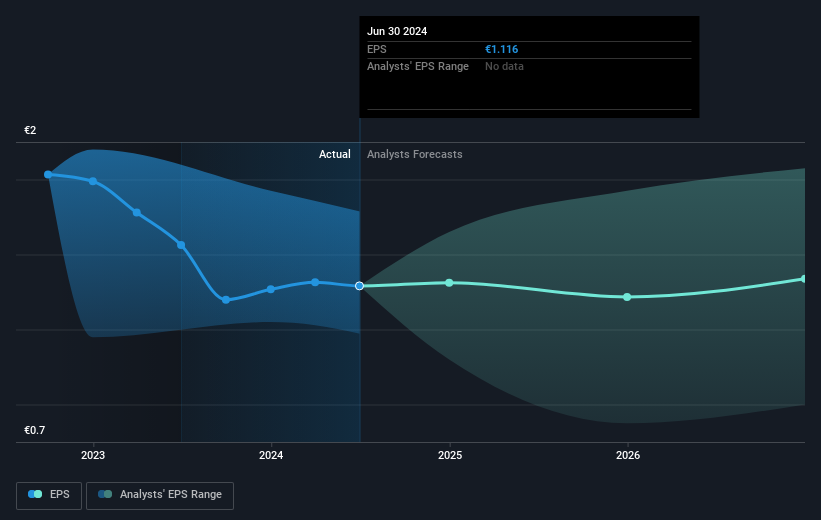
During the five years over which the share price declined, Proximus' earnings per share (EPS) dropped by 7.5% each year. This reduction in EPS is less than the 23% annual reduction in the share price. This implies that the market is more cautious about the business these days. The less favorable sentiment is reflected in its current P/E ratio of 6.21.
You can see below how EPS has changed over time (discover the exact values by clicking on the image).
Before buying or selling a stock, we always recommend a close examination of historic growth trends, available here.
What About Dividends?
It is important to consider the total shareholder return, as well as the share price return, for any given stock. Whereas the share price return only reflects the change in the share price, the TSR includes the value of dividends (assuming they were reinvested) and the benefit of any discounted capital raising or spin-off. Arguably, the TSR gives a more comprehensive picture of the return generated by a stock. In the case of Proximus, it has a TSR of -62% for the last 5 years. That exceeds its share price return that we previously mentioned. This is largely a result of its dividend payments!
A Different Perspective
Proximus shareholders are up 1.9% for the year (even including dividends). But that return falls short of the market. On the bright side, that's still a gain, and it is certainly better than the yearly loss of about 10% endured over half a decade. So this might be a sign the business has turned its fortunes around. I find it very interesting to look at share price over the long term as a proxy for business performance. But to truly gain insight, we need to consider other information, too. To that end, you should learn about the 3 warning signs we've spotted with Proximus (including 2 which are concerning) .
If you are like me, then you will not want to miss this free list of undervalued small caps that insiders are buying.
Please note, the market returns quoted in this article reflect the market weighted average returns of stocks that currently trade on Belgian exchanges.
New: Manage All Your Stock Portfolios in One Place
We've created the ultimate portfolio companion for stock investors, and it's free.
• Connect an unlimited number of Portfolios and see your total in one currency
• Be alerted to new Warning Signs or Risks via email or mobile
• Track the Fair Value of your stocks
Have feedback on this article? Concerned about the content? Get in touch with us directly. Alternatively, email editorial-team (at) simplywallst.com.
This article by Simply Wall St is general in nature. We provide commentary based on historical data and analyst forecasts only using an unbiased methodology and our articles are not intended to be financial advice. It does not constitute a recommendation to buy or sell any stock, and does not take account of your objectives, or your financial situation. We aim to bring you long-term focused analysis driven by fundamental data. Note that our analysis may not factor in the latest price-sensitive company announcements or qualitative material. Simply Wall St has no position in any stocks mentioned.
About ENXTBR:PROX
Proximus
Provides digital services and communication solutions in Belgium and internationally.
Proven track record second-rate dividend payer.

