- Belgium
- /
- Diversified Financial
- /
- ENXTBR:GBLB
Investors in Groupe Bruxelles Lambert (EBR:GBLB) have unfortunately lost 21% over the last three years


As an investor its worth striving to ensure your overall portfolio beats the market average. But the risk of stock picking is that you will likely buy under-performing companies. Unfortunately, that's been the case for longer term Groupe Bruxelles Lambert SA (EBR:GBLB) shareholders, since the share price is down 27% in the last three years, falling well short of the market decline of around 7.2%.
With that in mind, it's worth seeing if the company's underlying fundamentals have been the driver of long term performance, or if there are some discrepancies.
Check out our latest analysis for Groupe Bruxelles Lambert
To quote Buffett, 'Ships will sail around the world but the Flat Earth Society will flourish. There will continue to be wide discrepancies between price and value in the marketplace...' One imperfect but simple way to consider how the market perception of a company has shifted is to compare the change in the earnings per share (EPS) with the share price movement.
During five years of share price growth, Groupe Bruxelles Lambert moved from a loss to profitability. We would usually expect to see the share price rise as a result. So given the share price is down it's worth checking some other metrics too.
With revenue flat over three years, it seems unlikely that the share price is reflecting the top line. We're not entirely sure why the share price is dropped, but it does seem likely investors have become less optimistic about the business.
The image below shows how earnings and revenue have tracked over time (if you click on the image you can see greater detail).
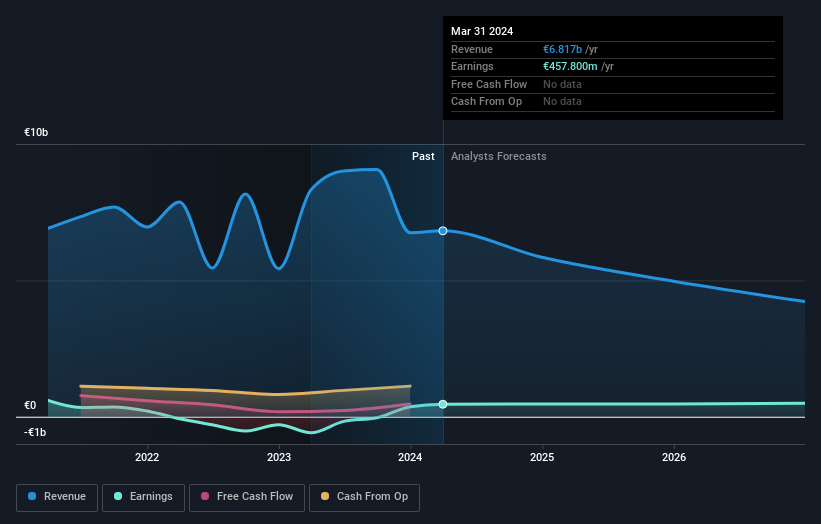
We know that Groupe Bruxelles Lambert has improved its bottom line lately, but what does the future have in store? If you are thinking of buying or selling Groupe Bruxelles Lambert stock, you should check out this free report showing analyst profit forecasts.
What About Dividends?
As well as measuring the share price return, investors should also consider the total shareholder return (TSR). Whereas the share price return only reflects the change in the share price, the TSR includes the value of dividends (assuming they were reinvested) and the benefit of any discounted capital raising or spin-off. Arguably, the TSR gives a more comprehensive picture of the return generated by a stock. We note that for Groupe Bruxelles Lambert the TSR over the last 3 years was -21%, which is better than the share price return mentioned above. The dividends paid by the company have thusly boosted the total shareholder return.
A Different Perspective
Investors in Groupe Bruxelles Lambert had a tough year, with a total loss of 1.6% (including dividends), against a market gain of about 9.3%. However, keep in mind that even the best stocks will sometimes underperform the market over a twelve month period. However, the loss over the last year isn't as bad as the 1.6% per annum loss investors have suffered over the last half decade. We would want clear information suggesting the company will grow, before taking the view that the share price will stabilize. It's always interesting to track share price performance over the longer term. But to understand Groupe Bruxelles Lambert better, we need to consider many other factors. For example, we've discovered 2 warning signs for Groupe Bruxelles Lambert that you should be aware of before investing here.
We will like Groupe Bruxelles Lambert better if we see some big insider buys. While we wait, check out this free list of undervalued stocks (mostly small caps) with considerable, recent, insider buying.
Please note, the market returns quoted in this article reflect the market weighted average returns of stocks that currently trade on Belgian exchanges.
New: Manage All Your Stock Portfolios in One Place
We've created the ultimate portfolio companion for stock investors, and it's free.
• Connect an unlimited number of Portfolios and see your total in one currency
• Be alerted to new Warning Signs or Risks via email or mobile
• Track the Fair Value of your stocks
Have feedback on this article? Concerned about the content? Get in touch with us directly. Alternatively, email editorial-team (at) simplywallst.com.
This article by Simply Wall St is general in nature. We provide commentary based on historical data and analyst forecasts only using an unbiased methodology and our articles are not intended to be financial advice. It does not constitute a recommendation to buy or sell any stock, and does not take account of your objectives, or your financial situation. We aim to bring you long-term focused analysis driven by fundamental data. Note that our analysis may not factor in the latest price-sensitive company announcements or qualitative material. Simply Wall St has no position in any stocks mentioned.
Have feedback on this article? Concerned about the content? Get in touch with us directly. Alternatively, email editorial-team@simplywallst.com
About ENXTBR:GBLB
Groupe Bruxelles Lambert
Invests in a portfolio of industrial, consumer goods, and business service companies operating in various sectors in Belgium, other European countries, North America, and internationally.
Fair value with moderate growth potential.

