
Advertisement
Hubify Limited (ASX:HFY) Soars 36% But It's A Story Of Risk Vs Reward
Those holding Hubify Limited (ASX:HFY) shares would be relieved that the share price has rebounded 36% in the last thirty days, but it needs to keep going to repair the recent damage it has caused to investor portfolios. Not all shareholders will be feeling jubilant, since the share price is still down a very disappointing 48% in the last twelve months.
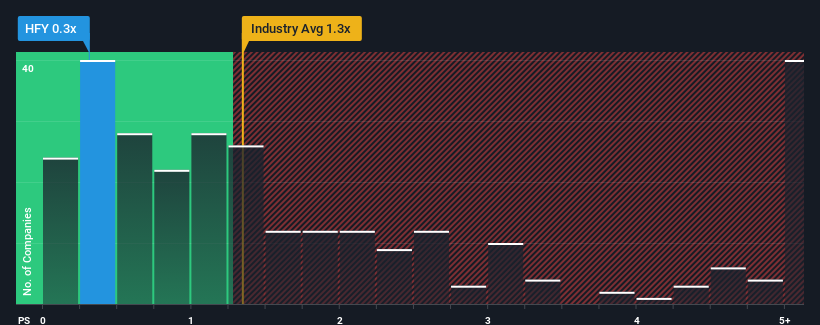
Although its price has surged higher, considering around half the companies operating in Australia's Telecom industry have price-to-sales ratios (or "P/S") above 1.2x, you may still consider Hubify as an solid investment opportunity with its 0.3x P/S ratio. However, the P/S might be low for a reason and it requires further investigation to determine if it's justified.
See our latest analysis for Hubify
What Does Hubify's Recent Performance Look Like?
For example, consider that Hubify's financial performance has been poor lately as its revenue has been in decline. It might be that many expect the disappointing revenue performance to continue or accelerate, which has repressed the P/S. Those who are bullish on Hubify will be hoping that this isn't the case so that they can pick up the stock at a lower valuation.
We don't have analyst forecasts, but you can see how recent trends are setting up the company for the future by checking out our free report on Hubify's earnings, revenue and cash flow.Is There Any Revenue Growth Forecasted For Hubify?
Hubify's P/S ratio would be typical for a company that's only expected to deliver limited growth, and importantly, perform worse than the industry.
In reviewing the last year of financials, we were disheartened to see the company's revenues fell to the tune of 3.2%. However, a few very strong years before that means that it was still able to grow revenue by an impressive 34% in total over the last three years. So we can start by confirming that the company has generally done a very good job of growing revenue over that time, even though it had some hiccups along the way.
Comparing that recent medium-term revenue trajectory with the industry's one-year growth forecast of 6.3% shows it's noticeably more attractive.
With this information, we find it odd that Hubify is trading at a P/S lower than the industry. It looks like most investors are not convinced the company can maintain its recent growth rates.
The Final Word
Hubify's stock price has surged recently, but its but its P/S still remains modest. Using the price-to-sales ratio alone to determine if you should sell your stock isn't sensible, however it can be a practical guide to the company's future prospects.
Our examination of Hubify revealed its three-year revenue trends aren't boosting its P/S anywhere near as much as we would have predicted, given they look better than current industry expectations. When we see strong revenue with faster-than-industry growth, we assume there are some significant underlying risks to the company's ability to make money which is applying downwards pressure on the P/S ratio. At least price risks look to be very low if recent medium-term revenue trends continue, but investors seem to think future revenue could see a lot of volatility.
Before you take the next step, you should know about the 3 warning signs for Hubify that we have uncovered.
If you're unsure about the strength of Hubify's business, why not explore our interactive list of stocks with solid business fundamentals for some other companies you may have missed.
Valuation is complex, but we're here to simplify it.
Discover if Hubify might be undervalued or overvalued with our detailed analysis, featuring fair value estimates, potential risks, dividends, insider trades, and its financial condition.
Access Free AnalysisHave feedback on this article? Concerned about the content? Get in touch with us directly. Alternatively, email editorial-team (at) simplywallst.com.
This article by Simply Wall St is general in nature. We provide commentary based on historical data and analyst forecasts only using an unbiased methodology and our articles are not intended to be financial advice. It does not constitute a recommendation to buy or sell any stock, and does not take account of your objectives, or your financial situation. We aim to bring you long-term focused analysis driven by fundamental data. Note that our analysis may not factor in the latest price-sensitive company announcements or qualitative material. Simply Wall St has no position in any stocks mentioned.
About ASX:HFY
Hubify
Engages in the sale, customization, and integration of IT and telecommunications systems in Australia.
Flawless balance sheet with low risk.
Market Insights

Advertisement
Community Narratives
MicroVision will explode future revenue by 380.37% with a vision towards success
Fair Value US$60.00|98.4% undervalued
TH
Community Contributor
The Indispensable Artery for a New North American Economy
Fair Value CA$132.87|1.3% undervalued
TI
Community Contributor