Vection Technologies Limited (ASX:VR1) Might Not Be As Mispriced As It Looks After Plunging 30%
The Vection Technologies Limited (ASX:VR1) share price has fared very poorly over the last month, falling by a substantial 30%. The drop over the last 30 days has capped off a tough year for shareholders, with the share price down 47% in that time.
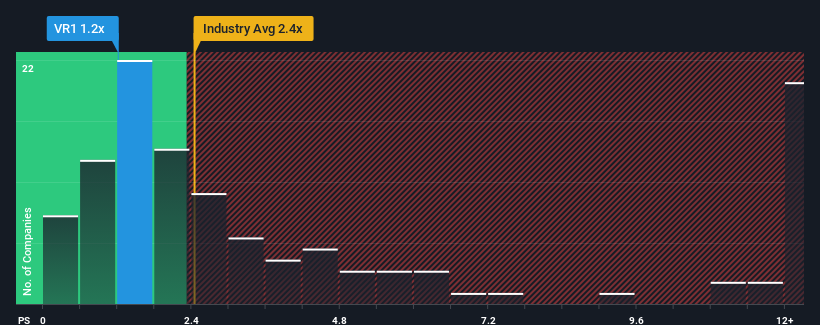
Since its price has dipped substantially, Vection Technologies may be sending buy signals at present with its price-to-sales (or "P/S") ratio of 1.2x, considering almost half of all companies in the Software industry in Australia have P/S ratios greater than 2.4x and even P/S higher than 6x aren't out of the ordinary. However, the P/S might be low for a reason and it requires further investigation to determine if it's justified.
Check out our latest analysis for Vection Technologies

How Has Vection Technologies Performed Recently?
Recent times have been quite advantageous for Vection Technologies as its revenue has been rising very briskly. Perhaps the market is expecting future revenue performance to dwindle, which has kept the P/S suppressed. Those who are bullish on Vection Technologies will be hoping that this isn't the case, so that they can pick up the stock at a lower valuation.
Want the full picture on earnings, revenue and cash flow for the company? Then our free report on Vection Technologies will help you shine a light on its historical performance.How Is Vection Technologies' Revenue Growth Trending?
There's an inherent assumption that a company should underperform the industry for P/S ratios like Vection Technologies' to be considered reasonable.
Retrospectively, the last year delivered an exceptional 43% gain to the company's top line. Spectacularly, three year revenue growth has ballooned by several orders of magnitude, thanks in part to the last 12 months of revenue growth. Therefore, it's fair to say the revenue growth recently has been superb for the company.
When compared to the industry's one-year growth forecast of 58%, the most recent medium-term revenue trajectory is noticeably more alluring
With this in mind, we find it intriguing that Vection Technologies' P/S isn't as high compared to that of its industry peers. Apparently some shareholders believe the recent performance has exceeded its limits and have been accepting significantly lower selling prices.
The Bottom Line On Vection Technologies' P/S
The southerly movements of Vection Technologies' shares means its P/S is now sitting at a pretty low level. While the price-to-sales ratio shouldn't be the defining factor in whether you buy a stock or not, it's quite a capable barometer of revenue expectations.
We're very surprised to see Vection Technologies currently trading on a much lower than expected P/S since its recent three-year growth is higher than the wider industry forecast. When we see robust revenue growth that outpaces the industry, we presume that there are notable underlying risks to the company's future performance, which is exerting downward pressure on the P/S ratio. While recent revenue trends over the past medium-term suggest that the risk of a price decline is low, investors appear to perceive a likelihood of revenue fluctuations in the future.
You need to take note of risks, for example - Vection Technologies has 3 warning signs (and 2 which don't sit too well with us) we think you should know about.
Of course, profitable companies with a history of great earnings growth are generally safer bets. So you may wish to see this free collection of other companies that have reasonable P/E ratios and have grown earnings strongly.
New: Manage All Your Stock Portfolios in One Place
We've created the ultimate portfolio companion for stock investors, and it's free.
• Connect an unlimited number of Portfolios and see your total in one currency
• Be alerted to new Warning Signs or Risks via email or mobile
• Track the Fair Value of your stocks
Have feedback on this article? Concerned about the content? Get in touch with us directly. Alternatively, email editorial-team (at) simplywallst.com.
This article by Simply Wall St is general in nature. We provide commentary based on historical data and analyst forecasts only using an unbiased methodology and our articles are not intended to be financial advice. It does not constitute a recommendation to buy or sell any stock, and does not take account of your objectives, or your financial situation. We aim to bring you long-term focused analysis driven by fundamental data. Note that our analysis may not factor in the latest price-sensitive company announcements or qualitative material. Simply Wall St has no position in any stocks mentioned.
About ASX:VR1
Vection Technologies
An enterprise-focused company, develops and commercializes integrated digital transformation technology solutions and services in Australia.
Slight risk with mediocre balance sheet.
Market Insights
Community Narratives


Recently Updated Narratives


MINISO's fair value is projected at 26.69 with an anticipated PE ratio shift of 20x


The Quiet Giant That Became AI’s Power Grid


Nova Ljubljanska Banka d.d will expect a 11.2% revenue boost driving future growth
Popular Narratives


The company that turned a verb into a global necessity and basically runs the modern internet, digital ads, smartphones, maps, and AI.


MicroVision will explode future revenue by 380.37% with a vision towards success


