
Advertisement
We're Keeping An Eye On I Synergy Group's (ASX:IS3) Cash Burn Rate
We can readily understand why investors are attracted to unprofitable companies. For example, I Synergy Group (ASX:IS3) shareholders have done very well over the last year, with the share price soaring by 131%. Having said that, unprofitable companies are risky because they could potentially burn through all their cash and become distressed.
Given its strong share price performance, we think it's worthwhile for I Synergy Group shareholders to consider whether its cash burn is concerning. For the purpose of this article, we'll define cash burn as the amount of cash the company is spending each year to fund its growth (also called its negative free cash flow). The first step is to compare its cash burn with its cash reserves, to give us its 'cash runway'.
View our latest analysis for I Synergy Group
When Might I Synergy Group Run Out Of Money?
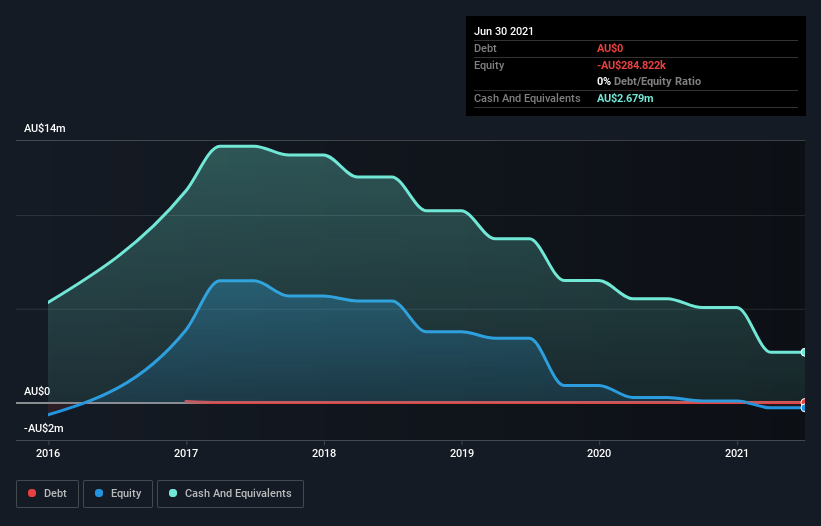
A company's cash runway is calculated by dividing its cash hoard by its cash burn. When I Synergy Group last reported its balance sheet in June 2021, it had zero debt and cash worth AU$2.7m. Looking at the last year, the company burnt through AU$2.6m. Therefore, from June 2021 it had roughly 13 months of cash runway. While that cash runway isn't too concerning, sensible holders would be peering into the distance, and considering what happens if the company runs out of cash. Depicted below, you can see how its cash holdings have changed over time.
How Well Is I Synergy Group Growing?
I Synergy Group actually ramped up its cash burn by a whopping 83% in the last year, which shows it is boosting investment in the business. While that's concerning on it's own, the fact that operating revenue was actually down 29% over the same period makes us positively tremulous. Considering both these metrics, we're a little concerned about how the company is developing. In reality, this article only makes a short study of the company's growth data. This graph of historic earnings and revenue shows how I Synergy Group is building its business over time.
Can I Synergy Group Raise More Cash Easily?
I Synergy Group revenue is declining and its cash burn is increasing, so many may be considering its need to raise more cash in the future. Companies can raise capital through either debt or equity. One of the main advantages held by publicly listed companies is that they can sell shares to investors to raise cash and fund growth. By comparing a company's annual cash burn to its total market capitalisation, we can estimate roughly how many shares it would have to issue in order to run the company for another year (at the same burn rate).
I Synergy Group's cash burn of AU$2.6m is about 7.8% of its AU$33m market capitalisation. Given that is a rather small percentage, it would probably be really easy for the company to fund another year's growth by issuing some new shares to investors, or even by taking out a loan.
So, Should We Worry About I Synergy Group's Cash Burn?
Even though its increasing cash burn makes us a little nervous, we are compelled to mention that we thought I Synergy Group's cash burn relative to its market cap was relatively promising. We don't think its cash burn is particularly problematic, but after considering the range of factors in this article, we do think shareholders should be monitoring how it changes over time. On another note, we conducted an in-depth investigation of the company, and identified 5 warning signs for I Synergy Group (3 make us uncomfortable!) that you should be aware of before investing here.
If you would prefer to check out another company with better fundamentals, then do not miss this free list of interesting companies, that have HIGH return on equity and low debt or this list of stocks which are all forecast to grow.
New: AI Stock Screener & Alerts
Our new AI Stock Screener scans the market every day to uncover opportunities.
• Dividend Powerhouses (3%+ Yield)
• Undervalued Small Caps with Insider Buying
• High growth Tech and AI Companies
Or build your own from over 50 metrics.
Have feedback on this article? Concerned about the content? Get in touch with us directly. Alternatively, email editorial-team (at) simplywallst.com.
This article by Simply Wall St is general in nature. We provide commentary based on historical data and analyst forecasts only using an unbiased methodology and our articles are not intended to be financial advice. It does not constitute a recommendation to buy or sell any stock, and does not take account of your objectives, or your financial situation. We aim to bring you long-term focused analysis driven by fundamental data. Note that our analysis may not factor in the latest price-sensitive company announcements or qualitative material. Simply Wall St has no position in any stocks mentioned.
About ASX:IS3
I Synergy Group
Provides affiliate marketing solutions to advertisers and affiliates in the digital marketplace in Malaysia.
Moderate risk with imperfect balance sheet.
Market Insights

Advertisement
Community Narratives
The company that turned a verb into a global necessity and basically runs the modern internet, digital ads, smartphones, maps, and AI.
Fair Value US$300.00|7.1% undervalued
OS
Community Contributor
Flowers Foods Pays A Fair Price For Health
Fair Value US$16.12|26.4% undervalued
NV
Community Contributor
TMX Group will thrive with 33.3% profit margin and enduring market moat
Fair Value CA$49.90|0.8% overvalued
LI
Community Contributor
The "Molecular Pencil": Why Beam's Technology is Built to Win
Fair Value US$65.01|65.8% undervalued
DA
Community Contributor