Stock Analysis
- Australia
- /
- Specialty Stores
- /
- ASX:TPW
Temple & Webster Group Ltd's (ASX:TPW) Stock Is Going Strong: Have Financials A Role To Play?


Most readers would already be aware that Temple & Webster Group's (ASX:TPW) stock increased significantly by 50% over the past three months. Given that stock prices are usually aligned with a company's financial performance in the long-term, we decided to study its financial indicators more closely to see if they had a hand to play in the recent price move. Particularly, we will be paying attention to Temple & Webster Group's ROE today.
Return on equity or ROE is a key measure used to assess how efficiently a company's management is utilizing the company's capital. In short, ROE shows the profit each dollar generates with respect to its shareholder investments.
Check out our latest analysis for Temple & Webster Group
How To Calculate Return On Equity?
The formula for return on equity is:
Return on Equity = Net Profit (from continuing operations) ÷ Shareholders' Equity
So, based on the above formula, the ROE for Temple & Webster Group is:
7.9% = AU$8.6m ÷ AU$108m (Based on the trailing twelve months to December 2023).
The 'return' is the amount earned after tax over the last twelve months. One way to conceptualize this is that for each A$1 of shareholders' capital it has, the company made A$0.08 in profit.
Why Is ROE Important For Earnings Growth?
Thus far, we have learned that ROE measures how efficiently a company is generating its profits. Depending on how much of these profits the company reinvests or "retains", and how effectively it does so, we are then able to assess a company’s earnings growth potential. Generally speaking, other things being equal, firms with a high return on equity and profit retention, have a higher growth rate than firms that don’t share these attributes.
A Side By Side comparison of Temple & Webster Group's Earnings Growth And 7.9% ROE
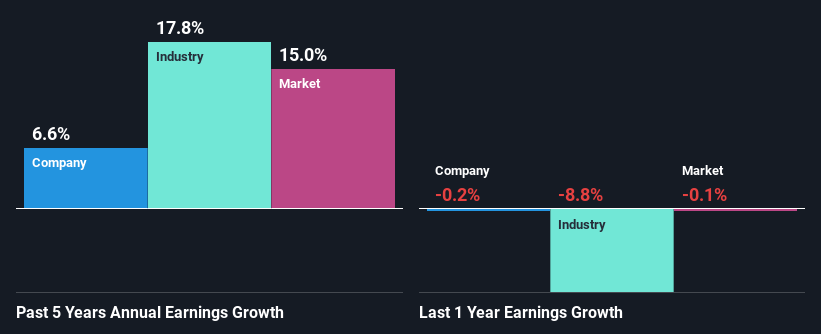
When you first look at it, Temple & Webster Group's ROE doesn't look that attractive. A quick further study shows that the company's ROE doesn't compare favorably to the industry average of 17% either. Although, we can see that Temple & Webster Group saw a modest net income growth of 6.6% over the past five years. So, the growth in the company's earnings could probably have been caused by other variables. For instance, the company has a low payout ratio or is being managed efficiently.
As a next step, we compared Temple & Webster Group's net income growth with the industry and were disappointed to see that the company's growth is lower than the industry average growth of 18% in the same period.
The basis for attaching value to a company is, to a great extent, tied to its earnings growth. It’s important for an investor to know whether the market has priced in the company's expected earnings growth (or decline). This then helps them determine if the stock is placed for a bright or bleak future. One good indicator of expected earnings growth is the P/E ratio which determines the price the market is willing to pay for a stock based on its earnings prospects. So, you may want to check if Temple & Webster Group is trading on a high P/E or a low P/E, relative to its industry.
Is Temple & Webster Group Efficiently Re-investing Its Profits?
Temple & Webster Group doesn't pay any dividend, meaning that all of its profits are being reinvested in the business, which explains the fair bit of earnings growth the company has seen.
Summary
In total, it does look like Temple & Webster Group has some positive aspects to its business. Specifically, its fairly high earnings growth number, which no doubt was backed by the company's high earnings retention. Still, the low ROE means that all that reinvestment is not reaping a lot of benefit to the investors. With that said, the latest industry analyst forecasts reveal that the company's earnings are expected to accelerate. To know more about the company's future earnings growth forecasts take a look at this free report on analyst forecasts for the company to find out more.
Valuation is complex, but we're helping make it simple.
Find out whether Temple & Webster Group is potentially over or undervalued by checking out our comprehensive analysis, which includes fair value estimates, risks and warnings, dividends, insider transactions and financial health.
View the Free AnalysisHave feedback on this article? Concerned about the content? Get in touch with us directly. Alternatively, email editorial-team (at) simplywallst.com.
This article by Simply Wall St is general in nature. We provide commentary based on historical data and analyst forecasts only using an unbiased methodology and our articles are not intended to be financial advice. It does not constitute a recommendation to buy or sell any stock, and does not take account of your objectives, or your financial situation. We aim to bring you long-term focused analysis driven by fundamental data. Note that our analysis may not factor in the latest price-sensitive company announcements or qualitative material. Simply Wall St has no position in any stocks mentioned.
About ASX:TPW
Temple & Webster Group
Temple & Webster Group Ltd engages in the online retail of furniture, homewares, and home improvement products in Australia.
Flawless balance sheet with reasonable growth potential.
