
Advertisement
We can readily understand why investors are attracted to unprofitable companies. For example, although Amazon.com made losses for many years after listing, if you had bought and held the shares since 1999, you would have made a fortune. But while history lauds those rare successes, those that fail are often forgotten; who remembers Pets.com?
So, the natural question for VHM (ASX:VHM) shareholders is whether they should be concerned by its rate of cash burn. For the purposes of this article, cash burn is the annual rate at which an unprofitable company spends cash to fund its growth; its negative free cash flow. The first step is to compare its cash burn with its cash reserves, to give us its 'cash runway'.
View our latest analysis for VHM
Does VHM Have A Long Cash Runway?
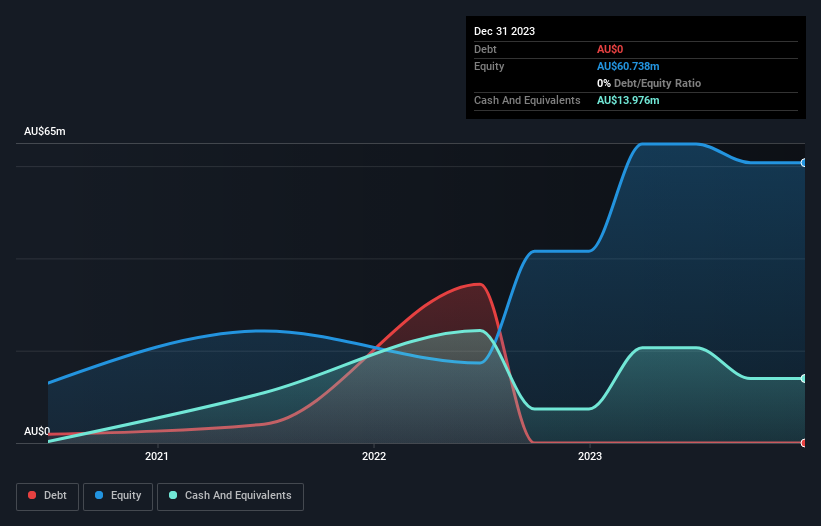
A company's cash runway is calculated by dividing its cash hoard by its cash burn. In December 2023, VHM had AU$14m in cash, and was debt-free. In the last year, its cash burn was AU$26m. That means it had a cash runway of around 6 months as of December 2023. That's quite a short cash runway, indicating the company must either reduce its annual cash burn or replenish its cash. You can see how its cash balance has changed over time in the image below.
How Is VHM's Cash Burn Changing Over Time?
Although VHM reported revenue of AU$88k last year, it didn't actually have any revenue from operations. To us, that makes it a pre-revenue company, so we'll look to its cash burn trajectory as an assessment of its cash burn situation. It's possible that the 7.5% reduction in cash burn over the last year is evidence of management tightening their belts as cash reserves deplete. Clearly, however, the crucial factor is whether the company will grow its business going forward. For that reason, it makes a lot of sense to take a look at our analyst forecasts for the company.
Can VHM Raise More Cash Easily?
Even though it has reduced its cash burn recently, shareholders should still consider how easy it would be for VHM to raise more cash in the future. Companies can raise capital through either debt or equity. Commonly, a business will sell new shares in itself to raise cash and drive growth. By comparing a company's annual cash burn to its total market capitalisation, we can estimate roughly how many shares it would have to issue in order to run the company for another year (at the same burn rate).
VHM has a market capitalisation of AU$91m and burnt through AU$26m last year, which is 29% of the company's market value. That's not insignificant, and if the company had to sell enough shares to fund another year's growth at the current share price, you'd likely witness fairly costly dilution.
Is VHM's Cash Burn A Worry?
On this analysis of VHM's cash burn, we think its cash burn reduction was reassuring, while its cash runway has us a bit worried. After looking at that range of measures, we think shareholders should be extremely attentive to how the company is using its cash, as the cash burn makes us uncomfortable. On another note, we conducted an in-depth investigation of the company, and identified 3 warning signs for VHM (2 are potentially serious!) that you should be aware of before investing here.
If you would prefer to check out another company with better fundamentals, then do not miss this free list of interesting companies, that have HIGH return on equity and low debt or this list of stocks which are all forecast to grow.
New: Manage All Your Stock Portfolios in One Place
We've created the ultimate portfolio companion for stock investors, and it's free.
• Connect an unlimited number of Portfolios and see your total in one currency
• Be alerted to new Warning Signs or Risks via email or mobile
• Track the Fair Value of your stocks
Have feedback on this article? Concerned about the content? Get in touch with us directly. Alternatively, email editorial-team (at) simplywallst.com.
This article by Simply Wall St is general in nature. We provide commentary based on historical data and analyst forecasts only using an unbiased methodology and our articles are not intended to be financial advice. It does not constitute a recommendation to buy or sell any stock, and does not take account of your objectives, or your financial situation. We aim to bring you long-term focused analysis driven by fundamental data. Note that our analysis may not factor in the latest price-sensitive company announcements or qualitative material. Simply Wall St has no position in any stocks mentioned.
About ASX:VHM
VHM
Engages in the exploration and development of mineral properties in Australia.
Excellent balance sheet with moderate risk.
Similar Companies
Market Insights

Advertisement
Community Narratives
MicroVision will explode future revenue by 380.37% with a vision towards success
Fair Value US$60.00|98.5% undervalued
TH
Community Contributor
The Indispensable Artery for a New North American Economy
Fair Value CA$132.87|2.3% undervalued
TI
Community Contributor