
Advertisement
Lacklustre Performance Is Driving SECOS Group Limited's (ASX:SES) 27% Price Drop
SECOS Group Limited (ASX:SES) shareholders that were waiting for something to happen have been dealt a blow with a 27% share price drop in the last month. The recent drop completes a disastrous twelve months for shareholders, who are sitting on a 68% loss during that time.
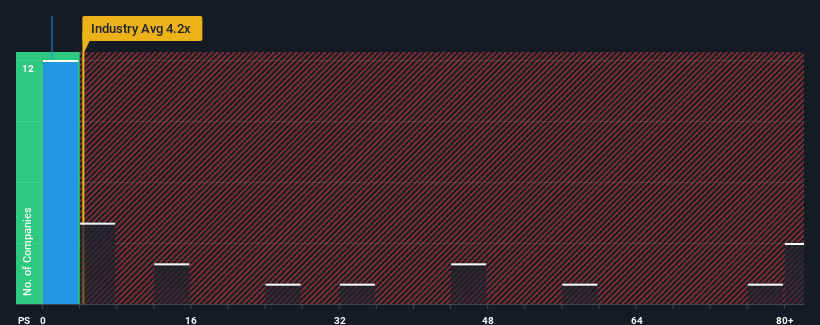
Since its price has dipped substantially, SECOS Group may look like a strong buying opportunity at present with its price-to-sales (or "P/S") ratio of 0.9x, considering almost half of all companies in the Chemicals industry in Australia have P/S ratios greater than 4.2x and even P/S higher than 46x aren't out of the ordinary. However, the P/S might be quite low for a reason and it requires further investigation to determine if it's justified.
View our latest analysis for SECOS Group
What Does SECOS Group's Recent Performance Look Like?
As an illustration, revenue has deteriorated at SECOS Group over the last year, which is not ideal at all. It might be that many expect the disappointing revenue performance to continue or accelerate, which has repressed the P/S. If you like the company, you'd be hoping this isn't the case so that you could potentially pick up some stock while it's out of favour.
We don't have analyst forecasts, but you can see how recent trends are setting up the company for the future by checking out our free report on SECOS Group's earnings, revenue and cash flow.Do Revenue Forecasts Match The Low P/S Ratio?
There's an inherent assumption that a company should far underperform the industry for P/S ratios like SECOS Group's to be considered reasonable.
Taking a look back first, the company's revenue growth last year wasn't something to get excited about as it posted a disappointing decline of 26%. That put a dampener on the good run it was having over the longer-term as its three-year revenue growth is still a noteworthy 8.5% in total. So we can start by confirming that the company has generally done a good job of growing revenue over that time, even though it had some hiccups along the way.
This is in contrast to the rest of the industry, which is expected to grow by 5,925% over the next year, materially higher than the company's recent medium-term annualised growth rates.
With this information, we can see why SECOS Group is trading at a P/S lower than the industry. Apparently many shareholders weren't comfortable holding on to something they believe will continue to trail the wider industry.
The Final Word
Having almost fallen off a cliff, SECOS Group's share price has pulled its P/S way down as well. Generally, our preference is to limit the use of the price-to-sales ratio to establishing what the market thinks about the overall health of a company.
Our examination of SECOS Group confirms that the company's revenue trends over the past three-year years are a key factor in its low price-to-sales ratio, as we suspected, given they fall short of current industry expectations. At this stage investors feel the potential for an improvement in revenue isn't great enough to justify a higher P/S ratio. Unless the recent medium-term conditions improve, they will continue to form a barrier for the share price around these levels.
Don't forget that there may be other risks. For instance, we've identified 2 warning signs for SECOS Group that you should be aware of.
It's important to make sure you look for a great company, not just the first idea you come across. So if growing profitability aligns with your idea of a great company, take a peek at this free list of interesting companies with strong recent earnings growth (and a low P/E).
New: Manage All Your Stock Portfolios in One Place
We've created the ultimate portfolio companion for stock investors, and it's free.
• Connect an unlimited number of Portfolios and see your total in one currency
• Be alerted to new Warning Signs or Risks via email or mobile
• Track the Fair Value of your stocks
Have feedback on this article? Concerned about the content? Get in touch with us directly. Alternatively, email editorial-team (at) simplywallst.com.
This article by Simply Wall St is general in nature. We provide commentary based on historical data and analyst forecasts only using an unbiased methodology and our articles are not intended to be financial advice. It does not constitute a recommendation to buy or sell any stock, and does not take account of your objectives, or your financial situation. We aim to bring you long-term focused analysis driven by fundamental data. Note that our analysis may not factor in the latest price-sensitive company announcements or qualitative material. Simply Wall St has no position in any stocks mentioned.
About ASX:MCO
Myeco Group
Develops, manufactures, and sells sustainable packaging and materials in Oceanic, Asia, the United States, Europe, and Africa.
Adequate balance sheet with low risk.
Market Insights

Advertisement
Community Narratives
The company that turned a verb into a global necessity and basically runs the modern internet, digital ads, smartphones, maps, and AI.
Fair Value US$300.00|7.5% undervalued
OS
Community Contributor
Flowers Foods Pays A Fair Price For Health
Fair Value US$16.12|25.4% undervalued
NV
Community Contributor
TMX Group will thrive with 33.3% profit margin and enduring market moat
Fair Value CA$49.90|3.6% overvalued
LI
Community Contributor
The "Molecular Pencil": Why Beam's Technology is Built to Win
Fair Value US$65.01|65.0% undervalued
DA
Community Contributor