Advertisement
- Australia
- /
- Metals and Mining
- /
- ASX:SBM
St Barbara (ASX:SBM) Valuation in Focus as Simberi Guidance and Capital Raising Announced

Simply Wall St
Reviewed by Kshitija Bhandaru
St Barbara (ASX:SBM) made headlines after releasing new gold production and cost guidance for 2026 at its Simberi Operations. This came as the company announced a proposed capital raising and provided a correction to its prior outlook.
See our latest analysis for St Barbara.
St Barbara’s recent guidance updates and news of a capital raising follow a stretch of renewed attention on the stock, especially as the company eyes a 21% boost in gold production at Simberi and moves to streamline its operations. While recent share price returns have been modest, the market’s response hints at cautious optimism toward these growth initiatives, and the 1-year total shareholder return paints a picture of slow but potentially building momentum as strategic projects progress.
If developments in the gold sector have sparked your interest, this could be the right moment to broaden your search and discover fast growing stocks with high insider ownership
With the stock trading just below its analyst price target and a pipeline of growth initiatives underway, investors are left to consider whether upside potential remains or if the market is already factoring in future gains.
Price-to-Sales of 3x: Is it justified?
St Barbara is currently trading at a price-to-sales (P/S) ratio of 3x, placing it below the recent closing price relative to its industry and peers. This suggests the market is potentially discounting the stock more than the sector as a whole.
The price-to-sales ratio compares a company’s market capitalization to its total revenues. For metals and mining companies, it is a valuable gauge because it filters out volatility in earnings and highlights sales as a key indicator of a company’s market worth, especially for unprofitable or cyclical businesses like St Barbara.
St Barbara’s own P/S ratio stands in stark contrast to the Australian Metals and Mining industry average, which comes in at 110.8x. Compared to its direct peers, which average 3.1x, St Barbara is also at a slight discount. If the market were to reassess the company’s growth prospects or operational outlook, there is room for the multiple to move closer to these broader benchmarks. According to regression analysis, however, its P/S remains above the estimated fair price-to-sales ratio of 1.3x, a level the market could target if sentiment cools.
Explore the SWS fair ratio for St Barbara
Result: Price-to-Sales of 3x (UNDERVALUE/ABOUT RIGHT/OVERVALUED according to industry context)
However, sustained negative net income and lack of profitability may limit upside if improvement in operational efficiency or gold prices does not materialize.
Find out about the key risks to this St Barbara narrative.
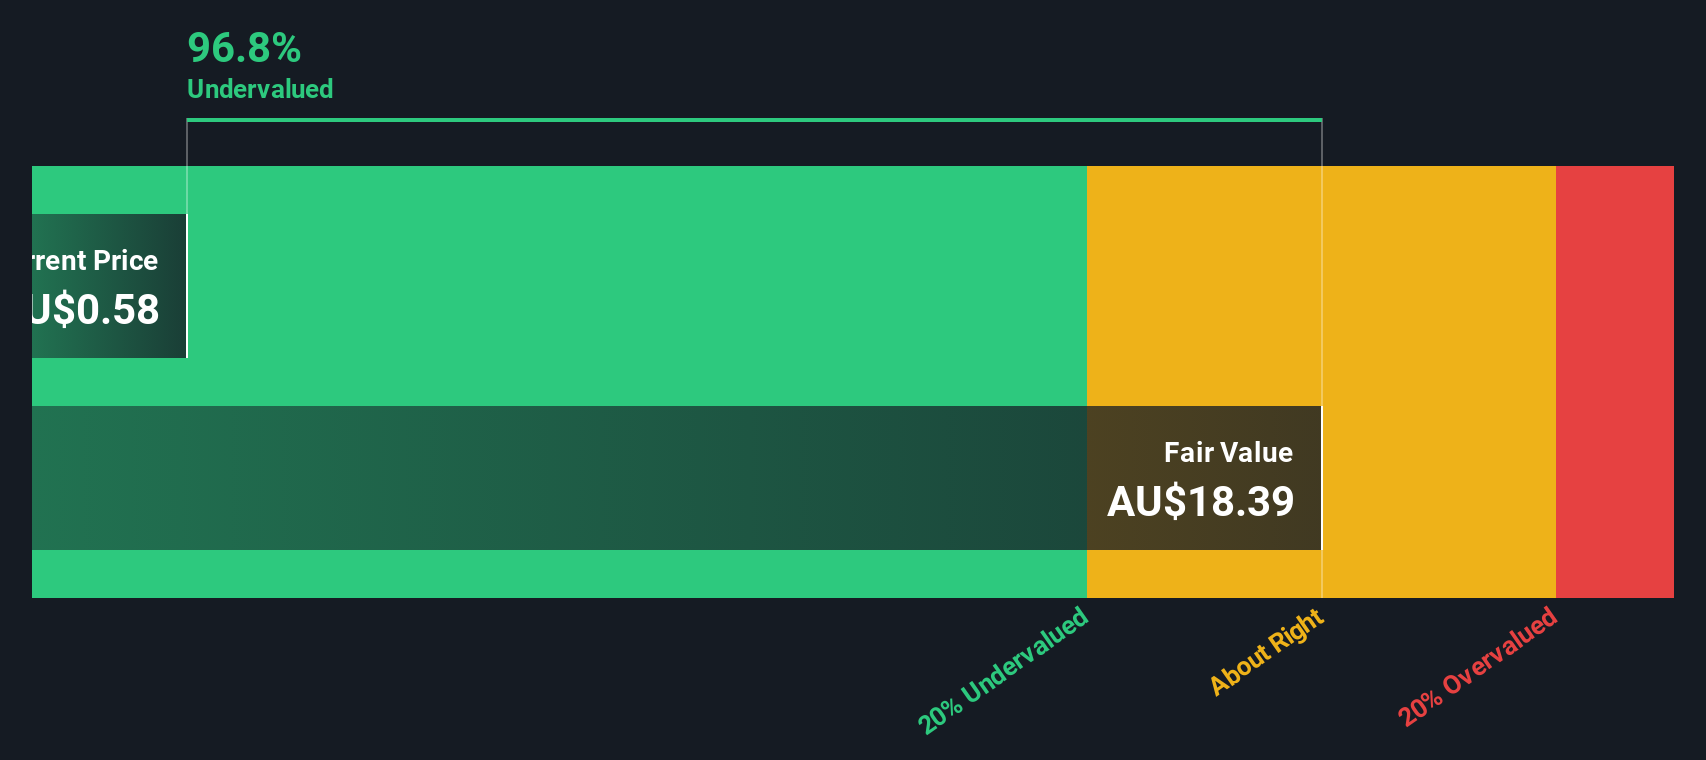
Another View: Discounted Cash Flow Perspective
While the price-to-sales ratio points to St Barbara trading at a discount to peers, our DCF model arrives at a much higher fair value than the current share price. This suggests a larger margin of potential undervaluation if the model's assumptions play out. Does this reveal a rare opportunity, or is there more risk beneath the surface?
Look into how the SWS DCF model arrives at its fair value.
Simply Wall St performs a discounted cash flow (DCF) on every stock in the world every day (check out St Barbara for example). We show the entire calculation in full. You can track the result in your watchlist or portfolio and be alerted when this changes, or use our stock screener to discover undervalued stocks based on their cash flows. If you save a screener we even alert you when new companies match - so you never miss a potential opportunity.
Build Your Own St Barbara Narrative
If you think there might be more to the story or would like to dig into the numbers yourself, you can quickly put together your own analysis in just a few minutes. Do it your way
A great starting point for your St Barbara research is our analysis highlighting 2 key rewards and 2 important warning signs that could impact your investment decision.
Looking for More Smart Investment Opportunities?
Why limit your search to just one company? Get ahead of the crowd by using our free screeners to uncover stocks making big moves in today’s market.
- Maximize your portfolio’s income potential by targeting strong yields with these 19 dividend stocks with yields > 3% available right now.
- Tap into the future of artificial intelligence and spot the fastest-rising players by browsing these 24 AI penny stocks today.
- Seize undervalued opportunities that others may have missed through these 896 undervalued stocks based on cash flows based on solid cash flows and fundamentals.
This article by Simply Wall St is general in nature. We provide commentary based on historical data and analyst forecasts only using an unbiased methodology and our articles are not intended to be financial advice. It does not constitute a recommendation to buy or sell any stock, and does not take account of your objectives, or your financial situation. We aim to bring you long-term focused analysis driven by fundamental data. Note that our analysis may not factor in the latest price-sensitive company announcements or qualitative material. Simply Wall St has no position in any stocks mentioned.
New: Manage All Your Stock Portfolios in One Place
We've created the ultimate portfolio companion for stock investors, and it's free.
• Connect an unlimited number of Portfolios and see your total in one currency
• Be alerted to new Warning Signs or Risks via email or mobile
• Track the Fair Value of your stocks
Have feedback on this article? Concerned about the content? Get in touch with us directly. Alternatively, email editorial-team@simplywallst.com
About ASX:SBM
St Barbara
Engages in the exploration, development, mining, and sale of gold.
Exceptional growth potential with flawless balance sheet.
Similar Companies
Market Insights

Advertisement
Community Narratives
MicroVision will explode future revenue by 380.37% with a vision towards success
Fair Value US$60|98.4% undervalued
TH
Community Contributor
The Indispensable Artery for a New North American Economy
Fair Value CA$132.87|1.6% undervalued
TI
Community Contributor
Recently Updated Narratives
BE


Bejgal on MINISO Group Holding ·
MINISO's fair value is projected at 26.69 with an anticipated PE ratio shift of 20x
Fair Value:US$26.6928.0% undervalued
44 followersusers have followed this narrative
3 commentsusers have commented on this narrative
0 likesusers have liked this narrative
TI


TickerTickle on Oracle ·
The Quiet Giant That Became AI’s Power Grid
Fair Value:US$389.8149.5% undervalued
7 followersusers have followed this narrative
1 commentusers have commented on this narrative
0 likesusers have liked this narrative
AU

AuCA on Nova Ljubljanska Banka d.d ·
Nova Ljubljanska Banka d.d will expect a 11.2% revenue boost driving future growth
Fair Value:€20916.5% undervalued
23 followersusers have followed this narrative
3 commentsusers have commented on this narrative
0 likesusers have liked this narrative
Popular Narratives
OS


oscargarcia on Alphabet ·
The company that turned a verb into a global necessity and basically runs the modern internet, digital ads, smartphones, maps, and AI.
Fair Value:US$3404.9% undervalued
136 followersusers have followed this narrative
6 commentsusers have commented on this narrative
18 likesusers have liked this narrative
TH

TheWallstreetKing on MicroVision ·
MicroVision will explode future revenue by 380.37% with a vision towards success
Fair Value:US$6098.4% undervalued
88 followersusers have followed this narrative
11 commentsusers have commented on this narrative
18 likesusers have liked this narrative
AN


AnalystConsensusTarget on NVIDIA ·
NVDA: Expanding AI Demand Will Drive Major Data Center Investments Through 2026
Fair Value:US$232.7923.6% undervalued
926 followersusers have followed this narrative
6 commentsusers have commented on this narrative
22 likesusers have liked this narrative