
Advertisement
- Australia
- /
- Basic Materials
- /
- ASX:JHX
James Hardie Industries plc's (ASX:JHX) Stock's On An Uptrend: Are Strong Financials Guiding The Market?
James Hardie Industries (ASX:JHX) has had a great run on the share market with its stock up by a significant 26% over the last three months. Given the company's impressive performance, we decided to study its financial indicators more closely as a company's financial health over the long-term usually dictates market outcomes. Particularly, we will be paying attention to James Hardie Industries' ROE today.
Return on Equity or ROE is a test of how effectively a company is growing its value and managing investors’ money. In short, ROE shows the profit each dollar generates with respect to its shareholder investments.
Check out our latest analysis for James Hardie Industries
How Is ROE Calculated?
ROE can be calculated by using the formula:
Return on Equity = Net Profit (from continuing operations) ÷ Shareholders' Equity
So, based on the above formula, the ROE for James Hardie Industries is:
28% = US$536m ÷ US$1.9b (Based on the trailing twelve months to December 2023).
The 'return' refers to a company's earnings over the last year. Another way to think of that is that for every A$1 worth of equity, the company was able to earn A$0.28 in profit.
What Is The Relationship Between ROE And Earnings Growth?
So far, we've learned that ROE is a measure of a company's profitability. We now need to evaluate how much profit the company reinvests or "retains" for future growth which then gives us an idea about the growth potential of the company. Assuming everything else remains unchanged, the higher the ROE and profit retention, the higher the growth rate of a company compared to companies that don't necessarily bear these characteristics.
James Hardie Industries' Earnings Growth And 28% ROE
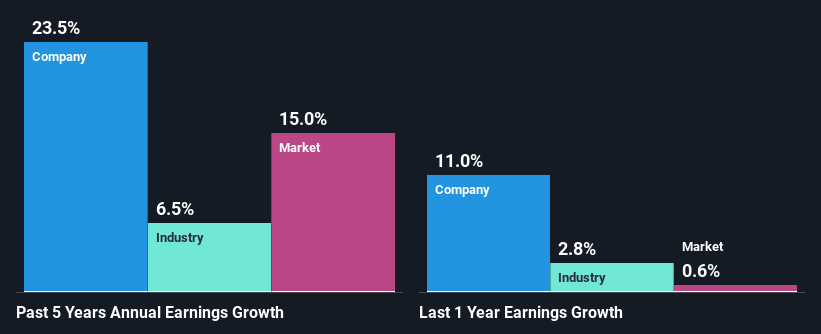
To begin with, James Hardie Industries has a pretty high ROE which is interesting. Second, a comparison with the average ROE reported by the industry of 11% also doesn't go unnoticed by us. So, the substantial 24% net income growth seen by James Hardie Industries over the past five years isn't overly surprising.
We then compared James Hardie Industries' net income growth with the industry and we're pleased to see that the company's growth figure is higher when compared with the industry which has a growth rate of 6.5% in the same 5-year period.
Earnings growth is a huge factor in stock valuation. What investors need to determine next is if the expected earnings growth, or the lack of it, is already built into the share price. This then helps them determine if the stock is placed for a bright or bleak future. If you're wondering about James Hardie Industries''s valuation, check out this gauge of its price-to-earnings ratio, as compared to its industry.
Is James Hardie Industries Efficiently Re-investing Its Profits?
While the company did pay out a portion of its dividend in the past, it currently doesn't pay a dividend. This is likely what's driving the high earnings growth number discussed above.
Existing analyst estimates suggest that the company's future payout ratio is expected to drop to 0.7% over the next three years. Regardless, the ROE is not expected to change much for the company despite the lower expected payout ratio.
Conclusion
In total, we are pretty happy with James Hardie Industries' performance. Specifically, we like that the company is reinvesting a huge chunk of its profits at a high rate of return. This of course has caused the company to see substantial growth in its earnings. Having said that, the company's earnings growth is expected to slow down, as forecasted in the current analyst estimates. Are these analysts expectations based on the broad expectations for the industry, or on the company's fundamentals? Click here to be taken to our analyst's forecasts page for the company.
New: Manage All Your Stock Portfolios in One Place
We've created the ultimate portfolio companion for stock investors, and it's free.
• Connect an unlimited number of Portfolios and see your total in one currency
• Be alerted to new Warning Signs or Risks via email or mobile
• Track the Fair Value of your stocks
Have feedback on this article? Concerned about the content? Get in touch with us directly. Alternatively, email editorial-team (at) simplywallst.com.
This article by Simply Wall St is general in nature. We provide commentary based on historical data and analyst forecasts only using an unbiased methodology and our articles are not intended to be financial advice. It does not constitute a recommendation to buy or sell any stock, and does not take account of your objectives, or your financial situation. We aim to bring you long-term focused analysis driven by fundamental data. Note that our analysis may not factor in the latest price-sensitive company announcements or qualitative material. Simply Wall St has no position in any stocks mentioned.
About ASX:JHX
James Hardie Industries
Engages in the manufacture and sale of fiber cement, fiber gypsum, and cement bonded boards in the United States, Australia, Europe, and New Zealand.
Good value with reasonable growth potential.
Similar Companies
Market Insights

Advertisement
Community Narratives
The company that turned a verb into a global necessity and basically runs the modern internet, digital ads, smartphones, maps, and AI.
Fair Value US$300.00|5.1% undervalued
OS
Community Contributor
Flowers Foods Pays A Fair Price For Health
Fair Value US$16.12|27.7% undervalued
NV
Community Contributor
TMX Group will thrive with 33.3% profit margin and enduring market moat
Fair Value CA$49.90|0.2% overvalued
LI
Community Contributor
The "Molecular Pencil": Why Beam's Technology is Built to Win
Fair Value US$65.01|64.4% undervalued
DA
Community Contributor