
Advertisement
- Australia
- /
- Metals and Mining
- /
- ASX:GUL
Gullewa Limited (ASX:GUL) Stock Has Shown Weakness Lately But Financials Look Strong: Should Prospective Shareholders Make The Leap?
Gullewa (ASX:GUL) has had a rough three months with its share price down 32%. However, a closer look at its sound financials might cause you to think again. Given that fundamentals usually drive long-term market outcomes, the company is worth looking at. In this article, we decided to focus on Gullewa's ROE.
ROE or return on equity is a useful tool to assess how effectively a company can generate returns on the investment it received from its shareholders. In short, ROE shows the profit each dollar generates with respect to its shareholder investments.
View our latest analysis for Gullewa
How Is ROE Calculated?
The formula for ROE is:
Return on Equity = Net Profit (from continuing operations) ÷ Shareholders' Equity
So, based on the above formula, the ROE for Gullewa is:
16% = AU$2.0m ÷ AU$12m (Based on the trailing twelve months to December 2020).
The 'return' refers to a company's earnings over the last year. Another way to think of that is that for every A$1 worth of equity, the company was able to earn A$0.16 in profit.
What Is The Relationship Between ROE And Earnings Growth?
We have already established that ROE serves as an efficient profit-generating gauge for a company's future earnings. Based on how much of its profits the company chooses to reinvest or "retain", we are then able to evaluate a company's future ability to generate profits. Assuming all else is equal, companies that have both a higher return on equity and higher profit retention are usually the ones that have a higher growth rate when compared to companies that don't have the same features.
Gullewa's Earnings Growth And 16% ROE
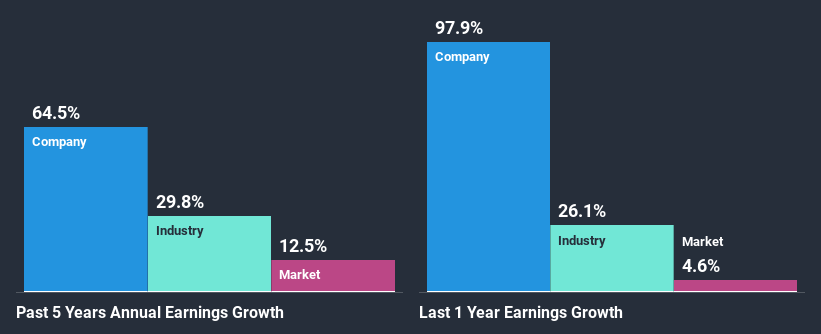
To begin with, Gullewa seems to have a respectable ROE. Further, the company's ROE is similar to the industry average of 15%. This certainly adds some context to Gullewa's exceptional 65% net income growth seen over the past five years. We reckon that there could also be other factors at play here. For example, it is possible that the company's management has made some good strategic decisions, or that the company has a low payout ratio.
As a next step, we compared Gullewa's net income growth with the industry, and pleasingly, we found that the growth seen by the company is higher than the average industry growth of 30%.
The basis for attaching value to a company is, to a great extent, tied to its earnings growth. It’s important for an investor to know whether the market has priced in the company's expected earnings growth (or decline). This then helps them determine if the stock is placed for a bright or bleak future. One good indicator of expected earnings growth is the P/E ratio which determines the price the market is willing to pay for a stock based on its earnings prospects. So, you may want to check if Gullewa is trading on a high P/E or a low P/E, relative to its industry.
Is Gullewa Using Its Retained Earnings Effectively?
Conclusion
Overall, we are quite pleased with Gullewa's performance. Particularly, we like that the company is reinvesting heavily into its business, and at a high rate of return. Unsurprisingly, this has led to an impressive earnings growth. If the company continues to grow its earnings the way it has, that could have a positive impact on its share price given how earnings per share influence long-term share prices. Not to forget, share price outcomes are also dependent on the potential risks a company may face. So it is important for investors to be aware of the risks involved in the business. To know the 5 risks we have identified for Gullewa visit our risks dashboard for free.
If you’re looking to trade Gullewa, open an account with the lowest-cost* platform trusted by professionals, Interactive Brokers. Their clients from over 200 countries and territories trade stocks, options, futures, forex, bonds and funds worldwide from a single integrated account. Promoted
New: Manage All Your Stock Portfolios in One Place
We've created the ultimate portfolio companion for stock investors, and it's free.
• Connect an unlimited number of Portfolios and see your total in one currency
• Be alerted to new Warning Signs or Risks via email or mobile
• Track the Fair Value of your stocks
This article by Simply Wall St is general in nature. It does not constitute a recommendation to buy or sell any stock, and does not take account of your objectives, or your financial situation. We aim to bring you long-term focused analysis driven by fundamental data. Note that our analysis may not factor in the latest price-sensitive company announcements or qualitative material. Simply Wall St has no position in any stocks mentioned.
*Interactive Brokers Rated Lowest Cost Broker by StockBrokers.com Annual Online Review 2020
Have feedback on this article? Concerned about the content? Get in touch with us directly. Alternatively, email editorial-team (at) simplywallst.com.
About ASX:GUL
Gullewa
Engages in the exploration, evaluation, and mining of mineral properties in Australia.
Flawless balance sheet with slight risk.
Market Insights

Advertisement
Community Narratives
MicroVision will explode future revenue by 380.37% with a vision towards success
Fair Value US$60.00|98.4% undervalued
TH
Community Contributor
The Indispensable Artery for a New North American Economy
Fair Value CA$132.87|1.3% undervalued
TI
Community Contributor