Stock Analysis
- Australia
- /
- Metals and Mining
- /
- ASX:GOR
Painful week for retail investors invested in Gold Road Resources Limited (ASX:GOR) after 4.9% drop, institutions also suffered losses

Key Insights
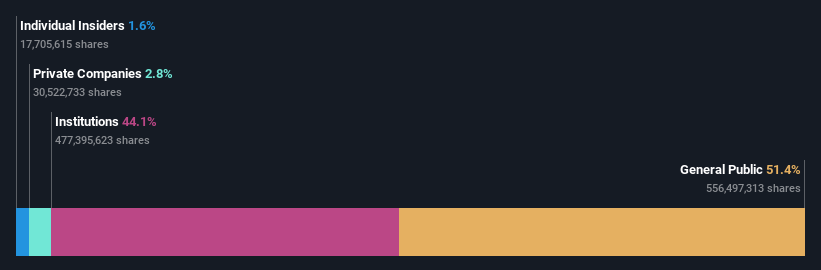
- Gold Road Resources' significant retail investors ownership suggests that the key decisions are influenced by shareholders from the larger public
- 43% of the business is held by the top 25 shareholders
- Institutional ownership in Gold Road Resources is 44%
To get a sense of who is truly in control of Gold Road Resources Limited (ASX:GOR), it is important to understand the ownership structure of the business. With 51% stake, retail investors possess the maximum shares in the company. Put another way, the group faces the maximum upside potential (or downside risk).
While institutions who own 44% came under pressure after market cap dropped to AU$1.7b last week,retail investors took the most losses.
Let's delve deeper into each type of owner of Gold Road Resources, beginning with the chart below.
See our latest analysis for Gold Road Resources
What Does The Institutional Ownership Tell Us About Gold Road Resources?
Institutional investors commonly compare their own returns to the returns of a commonly followed index. So they generally do consider buying larger companies that are included in the relevant benchmark index.
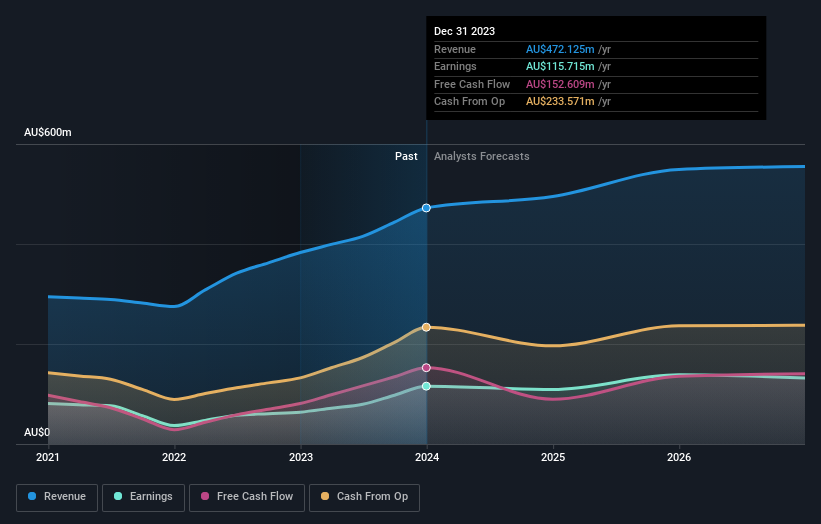
We can see that Gold Road Resources does have institutional investors; and they hold a good portion of the company's stock. This suggests some credibility amongst professional investors. But we can't rely on that fact alone since institutions make bad investments sometimes, just like everyone does. It is not uncommon to see a big share price drop if two large institutional investors try to sell out of a stock at the same time. So it is worth checking the past earnings trajectory of Gold Road Resources, (below). Of course, keep in mind that there are other factors to consider, too.
We note that hedge funds don't have a meaningful investment in Gold Road Resources. Van Eck Associates Corporation is currently the largest shareholder, with 10% of shares outstanding. Meanwhile, the second and third largest shareholders, hold 5.0% and 2.7%, of the shares outstanding, respectively.
A deeper look at our ownership data shows that the top 25 shareholders collectively hold less than half of the register, suggesting a large group of small holders where no single shareholder has a majority.
Researching institutional ownership is a good way to gauge and filter a stock's expected performance. The same can be achieved by studying analyst sentiments. Quite a few analysts cover the stock, so you could look into forecast growth quite easily.
Insider Ownership Of Gold Road Resources
While the precise definition of an insider can be subjective, almost everyone considers board members to be insiders. Company management run the business, but the CEO will answer to the board, even if he or she is a member of it.
I generally consider insider ownership to be a good thing. However, on some occasions it makes it more difficult for other shareholders to hold the board accountable for decisions.
We can report that insiders do own shares in Gold Road Resources Limited. It is a pretty big company, so it is generally a positive to see some potentially meaningful alignment. In this case, they own around AU$27m worth of shares (at current prices). Most would say this shows alignment of interests between shareholders and the board. Still, it might be worth checking if those insiders have been selling.
General Public Ownership
The general public, mostly comprising of individual investors, collectively holds 51% of Gold Road Resources shares. This level of ownership gives investors from the wider public some power to sway key policy decisions such as board composition, executive compensation, and the dividend payout ratio.
Next Steps:
It's always worth thinking about the different groups who own shares in a company. But to understand Gold Road Resources better, we need to consider many other factors.
I always like to check for a history of revenue growth. You can too, by accessing this free chart of historic revenue and earnings in this detailed graph.
Ultimately the future is most important. You can access this free report on analyst forecasts for the company.
NB: Figures in this article are calculated using data from the last twelve months, which refer to the 12-month period ending on the last date of the month the financial statement is dated. This may not be consistent with full year annual report figures.
Valuation is complex, but we're helping make it simple.
Find out whether Gold Road Resources is potentially over or undervalued by checking out our comprehensive analysis, which includes fair value estimates, risks and warnings, dividends, insider transactions and financial health.
View the Free AnalysisHave feedback on this article? Concerned about the content? Get in touch with us directly. Alternatively, email editorial-team (at) simplywallst.com.
This article by Simply Wall St is general in nature. We provide commentary based on historical data and analyst forecasts only using an unbiased methodology and our articles are not intended to be financial advice. It does not constitute a recommendation to buy or sell any stock, and does not take account of your objectives, or your financial situation. We aim to bring you long-term focused analysis driven by fundamental data. Note that our analysis may not factor in the latest price-sensitive company announcements or qualitative material. Simply Wall St has no position in any stocks mentioned.
About ASX:GOR
Gold Road Resources
Gold Road Resources Limited, together with its subsidiaries, engages in the exploration of gold properties in Western Australia.
Flawless balance sheet with solid track record.

