
Advertisement
Some say volatility, rather than debt, is the best way to think about risk as an investor, but Warren Buffett famously said that 'Volatility is far from synonymous with risk.' It's only natural to consider a company's balance sheet when you examine how risky it is, since debt is often involved when a business collapses. We can see that Citigold Corporation Limited (ASX:CTO) does use debt in its business. But the real question is whether this debt is making the company risky.
What Risk Does Debt Bring?
Debt and other liabilities become risky for a business when it cannot easily fulfill those obligations, either with free cash flow or by raising capital at an attractive price. Ultimately, if the company can't fulfill its legal obligations to repay debt, shareholders could walk away with nothing. While that is not too common, we often do see indebted companies permanently diluting shareholders because lenders force them to raise capital at a distressed price. Of course, debt can be an important tool in businesses, particularly capital heavy businesses. When we examine debt levels, we first consider both cash and debt levels, together.
See our latest analysis for Citigold
How Much Debt Does Citigold Carry?
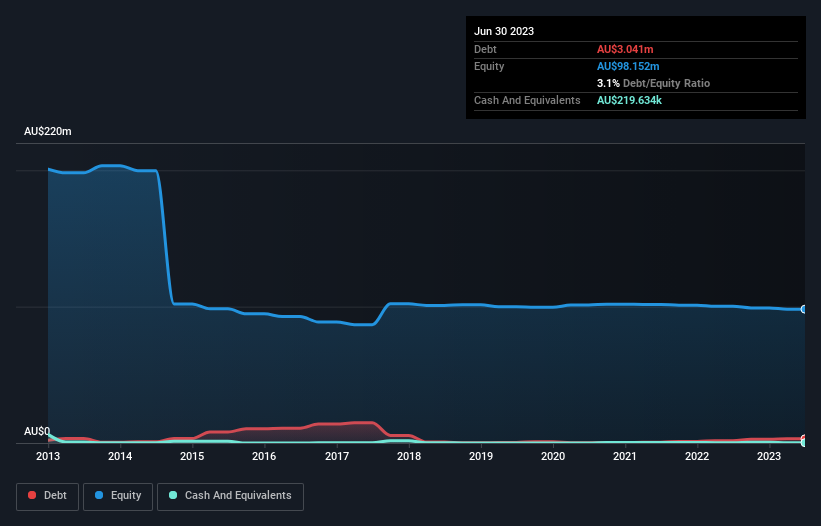
The image below, which you can click on for greater detail, shows that at June 2023 Citigold had debt of AU$3.04m, up from AU$1.68m in one year. However, it also had AU$219.6k in cash, and so its net debt is AU$2.82m.
How Strong Is Citigold's Balance Sheet?
The latest balance sheet data shows that Citigold had liabilities of AU$1.66m due within a year, and liabilities of AU$12.7m falling due after that. On the other hand, it had cash of AU$219.6k and AU$391.0k worth of receivables due within a year. So its liabilities total AU$13.7m more than the combination of its cash and short-term receivables.
This deficit is considerable relative to its market capitalization of AU$14.4m, so it does suggest shareholders should keep an eye on Citigold's use of debt. Should its lenders demand that it shore up the balance sheet, shareholders would likely face severe dilution. When analysing debt levels, the balance sheet is the obvious place to start. But it is Citigold's earnings that will influence how the balance sheet holds up in the future. So if you're keen to discover more about its earnings, it might be worth checking out this graph of its long term earnings trend.
Given its lack of meaningful operating revenue, investors are probably hoping that Citigold finds some valuable resources, before it runs out of money.
Caveat Emptor
Importantly, Citigold had an earnings before interest and tax (EBIT) loss over the last year. Its EBIT loss was a whopping AU$2.0m. When we look at that and recall the liabilities on its balance sheet, relative to cash, it seems unwise to us for the company to have any debt. Quite frankly we think the balance sheet is far from match-fit, although it could be improved with time. However, it doesn't help that it burned through AU$2.1m of cash over the last year. So suffice it to say we consider the stock very risky. The balance sheet is clearly the area to focus on when you are analysing debt. However, not all investment risk resides within the balance sheet - far from it. For example, we've discovered 5 warning signs for Citigold that you should be aware of before investing here.
Of course, if you're the type of investor who prefers buying stocks without the burden of debt, then don't hesitate to discover our exclusive list of net cash growth stocks, today.
New: AI Stock Screener & Alerts
Our new AI Stock Screener scans the market every day to uncover opportunities.
• Dividend Powerhouses (3%+ Yield)
• Undervalued Small Caps with Insider Buying
• High growth Tech and AI Companies
Or build your own from over 50 metrics.
Have feedback on this article? Concerned about the content? Get in touch with us directly. Alternatively, email editorial-team (at) simplywallst.com.
This article by Simply Wall St is general in nature. We provide commentary based on historical data and analyst forecasts only using an unbiased methodology and our articles are not intended to be financial advice. It does not constitute a recommendation to buy or sell any stock, and does not take account of your objectives, or your financial situation. We aim to bring you long-term focused analysis driven by fundamental data. Note that our analysis may not factor in the latest price-sensitive company announcements or qualitative material. Simply Wall St has no position in any stocks mentioned.
About ASX:CTO
Citigold
Engages in the exploration and development of mineral resources in Australia.
Moderate risk and slightly overvalued.
Similar Companies
Market Insights

Advertisement
Community Narratives
The company that turned a verb into a global necessity and basically runs the modern internet, digital ads, smartphones, maps, and AI.
Fair Value US$300.00|7.1% undervalued
OS
Community Contributor
Flowers Foods Pays A Fair Price For Health
Fair Value US$16.12|26.4% undervalued
NV
Community Contributor
TMX Group will thrive with 33.3% profit margin and enduring market moat
Fair Value CA$49.90|0.8% overvalued
LI
Community Contributor
The "Molecular Pencil": Why Beam's Technology is Built to Win
Fair Value US$65.01|65.8% undervalued
DA
Community Contributor