
Advertisement
- Australia
- /
- Metals and Mining
- /
- ASX:BLY
Calculating The Intrinsic Value Of Boart Longyear Group Ltd. (ASX:BLY)
Key Insights
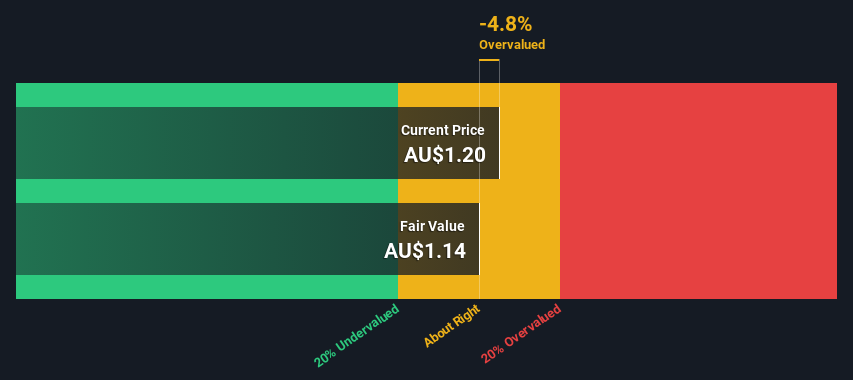
- The projected fair value for Boart Longyear Group is AU$1.14 based on 2 Stage Free Cash Flow to Equity
- Boart Longyear Group's AU$1.20 share price indicates it is trading at similar levels as its fair value estimate
- Boart Longyear Group's peers seem to be trading at a lower premium to fair value based onthe industry average of -4.1%
Today we'll do a simple run through of a valuation method used to estimate the attractiveness of Boart Longyear Group Ltd. (ASX:BLY) as an investment opportunity by taking the forecast future cash flows of the company and discounting them back to today's value. We will take advantage of the Discounted Cash Flow (DCF) model for this purpose. It may sound complicated, but actually it is quite simple!
We generally believe that a company's value is the present value of all of the cash it will generate in the future. However, a DCF is just one valuation metric among many, and it is not without flaws. If you want to learn more about discounted cash flow, the rationale behind this calculation can be read in detail in the Simply Wall St analysis model.
See our latest analysis for Boart Longyear Group
Is Boart Longyear Group Fairly Valued?
We're using the 2-stage growth model, which simply means we take in account two stages of company's growth. In the initial period the company may have a higher growth rate and the second stage is usually assumed to have a stable growth rate. In the first stage we need to estimate the cash flows to the business over the next ten years. Seeing as no analyst estimates of free cash flow are available to us, we have extrapolate the previous free cash flow (FCF) from the company's last reported value. We assume companies with shrinking free cash flow will slow their rate of shrinkage, and that companies with growing free cash flow will see their growth rate slow, over this period. We do this to reflect that growth tends to slow more in the early years than it does in later years.
Generally we assume that a dollar today is more valuable than a dollar in the future, and so the sum of these future cash flows is then discounted to today's value:
10-year free cash flow (FCF) estimate
| 2024 | 2025 | 2026 | 2027 | 2028 | 2029 | 2030 | 2031 | 2032 | 2033 | |
| Levered FCF ($, Millions) | US$13.8m | US$15.6m | US$17.1m | US$18.3m | US$19.4m | US$20.3m | US$21.1m | US$21.7m | US$22.4m | US$23.0m |
| Growth Rate Estimate Source | Est @ 17.59% | Est @ 12.91% | Est @ 9.64% | Est @ 7.35% | Est @ 5.75% | Est @ 4.63% | Est @ 3.84% | Est @ 3.29% | Est @ 2.91% | Est @ 2.64% |
| Present Value ($, Millions) Discounted @ 10% | US$12.5 | US$12.8 | US$12.7 | US$12.3 | US$11.8 | US$11.2 | US$10.5 | US$9.8 | US$9.2 | US$8.5 |
("Est" = FCF growth rate estimated by Simply Wall St)
Present Value of 10-year Cash Flow (PVCF) = US$111m
The second stage is also known as Terminal Value, this is the business's cash flow after the first stage. The Gordon Growth formula is used to calculate Terminal Value at a future annual growth rate equal to the 5-year average of the 10-year government bond yield of 2.0%. We discount the terminal cash flows to today's value at a cost of equity of 10%.
Terminal Value (TV)= FCF2033 × (1 + g) ÷ (r – g) = US$23m× (1 + 2.0%) ÷ (10%– 2.0%) = US$278m
Present Value of Terminal Value (PVTV)= TV / (1 + r)10= US$278m÷ ( 1 + 10%)10= US$103m
The total value, or equity value, is then the sum of the present value of the future cash flows, which in this case is US$214m. To get the intrinsic value per share, we divide this by the total number of shares outstanding. Compared to the current share price of AU$1.2, the company appears around fair value at the time of writing. Valuations are imprecise instruments though, rather like a telescope - move a few degrees and end up in a different galaxy. Do keep this in mind.
The Assumptions
We would point out that the most important inputs to a discounted cash flow are the discount rate and of course the actual cash flows. If you don't agree with these result, have a go at the calculation yourself and play with the assumptions. The DCF also does not consider the possible cyclicality of an industry, or a company's future capital requirements, so it does not give a full picture of a company's potential performance. Given that we are looking at Boart Longyear Group as potential shareholders, the cost of equity is used as the discount rate, rather than the cost of capital (or weighted average cost of capital, WACC) which accounts for debt. In this calculation we've used 10%, which is based on a levered beta of 1.684. Beta is a measure of a stock's volatility, compared to the market as a whole. We get our beta from the industry average beta of globally comparable companies, with an imposed limit between 0.8 and 2.0, which is a reasonable range for a stable business.
Moving On:
Valuation is only one side of the coin in terms of building your investment thesis, and it ideally won't be the sole piece of analysis you scrutinize for a company. The DCF model is not a perfect stock valuation tool. Rather it should be seen as a guide to "what assumptions need to be true for this stock to be under/overvalued?" For example, changes in the company's cost of equity or the risk free rate can significantly impact the valuation. For Boart Longyear Group, we've put together three important elements you should consider:
- Risks: We feel that you should assess the 2 warning signs for Boart Longyear Group we've flagged before making an investment in the company.
- Other Solid Businesses: Low debt, high returns on equity and good past performance are fundamental to a strong business. Why not explore our interactive list of stocks with solid business fundamentals to see if there are other companies you may not have considered!
- Other Environmentally-Friendly Companies: Concerned about the environment and think consumers will buy eco-friendly products more and more? Browse through our interactive list of companies that are thinking about a greener future to discover some stocks you may not have thought of!
PS. Simply Wall St updates its DCF calculation for every Australian stock every day, so if you want to find the intrinsic value of any other stock just search here.
Valuation is complex, but we're here to simplify it.
Discover if Boart Longyear Group might be undervalued or overvalued with our detailed analysis, featuring fair value estimates, potential risks, dividends, insider trades, and its financial condition.
Access Free AnalysisHave feedback on this article? Concerned about the content? Get in touch with us directly. Alternatively, email editorial-team (at) simplywallst.com.
This article by Simply Wall St is general in nature. We provide commentary based on historical data and analyst forecasts only using an unbiased methodology and our articles are not intended to be financial advice. It does not constitute a recommendation to buy or sell any stock, and does not take account of your objectives, or your financial situation. We aim to bring you long-term focused analysis driven by fundamental data. Note that our analysis may not factor in the latest price-sensitive company announcements or qualitative material. Simply Wall St has no position in any stocks mentioned.
About ASX:BLY
Boart Longyear Group
Boart Longyear Group Ltd., together with its subsidiaries, provides drilling services, drilling equipment, and performance tooling for mining and mineral drilling companies in North America, the Asia Pacific, Latin America, Europe, the Middle East, and Africa.
Proven track record with adequate balance sheet.
Similar Companies
Market Insights

Advertisement
Community Narratives
The company that turned a verb into a global necessity and basically runs the modern internet, digital ads, smartphones, maps, and AI.
Fair Value US$300.00|5.4% undervalued
OS
Community Contributor
Flowers Foods Pays A Fair Price For Health
Fair Value US$16.12|26.3% undervalued
NV
Community Contributor
TMX Group will thrive with 33.3% profit margin and enduring market moat
Fair Value CA$49.90|4.1% overvalued
LI
Community Contributor