
Advertisement
Is Advance NanoTek Limited's (ASX:ANO) Stock's Recent Performance Being Led By Its Attractive Financial Prospects?
Advance NanoTek's (ASX:ANO) stock is up by a considerable 46% over the past three months. Given that the market rewards strong financials in the long-term, we wonder if that is the case in this instance. In this article, we decided to focus on Advance NanoTek's ROE.
ROE or return on equity is a useful tool to assess how effectively a company can generate returns on the investment it received from its shareholders. In simpler terms, it measures the profitability of a company in relation to shareholder's equity.
Check out our latest analysis for Advance NanoTek
How Do You Calculate Return On Equity?
Return on equity can be calculated by using the formula:
Return on Equity = Net Profit (from continuing operations) ÷ Shareholders' Equity
So, based on the above formula, the ROE for Advance NanoTek is:
19% = AU$5.3m ÷ AU$28m (Based on the trailing twelve months to June 2020).
The 'return' is the profit over the last twelve months. That means that for every A$1 worth of shareholders' equity, the company generated A$0.19 in profit.
Why Is ROE Important For Earnings Growth?
We have already established that ROE serves as an efficient profit-generating gauge for a company's future earnings. We now need to evaluate how much profit the company reinvests or "retains" for future growth which then gives us an idea about the growth potential of the company. Assuming all else is equal, companies that have both a higher return on equity and higher profit retention are usually the ones that have a higher growth rate when compared to companies that don't have the same features.
Advance NanoTek's Earnings Growth And 19% ROE
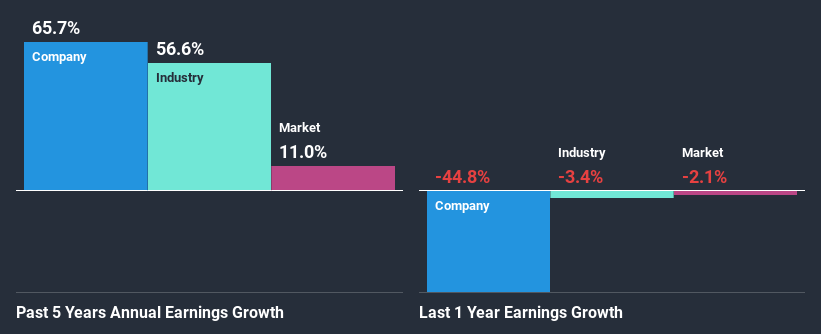
To begin with, Advance NanoTek seems to have a respectable ROE. Even when compared to the industry average of 19% the company's ROE looks quite decent. Consequently, this likely laid the ground for the impressive net income growth of 66% seen over the past five years by Advance NanoTek. We reckon that there could also be other factors at play here. For instance, the company has a low payout ratio or is being managed efficiently.
We then performed a comparison between Advance NanoTek's net income growth with the industry, which revealed that the company's growth is similar to the average industry growth of 57% in the same period.
The basis for attaching value to a company is, to a great extent, tied to its earnings growth. What investors need to determine next is if the expected earnings growth, or the lack of it, is already built into the share price. Doing so will help them establish if the stock's future looks promising or ominous. Is Advance NanoTek fairly valued compared to other companies? These 3 valuation measures might help you decide.
Is Advance NanoTek Making Efficient Use Of Its Profits?
Summary
Overall, we are quite pleased with Advance NanoTek's performance. Specifically, we like that the company is reinvesting a huge chunk of its profits at a high rate of return. This of course has caused the company to see substantial growth in its earnings. If the company continues to grow its earnings the way it has, that could have a positive impact on its share price given how earnings per share influence long-term share prices. Let's not forget, business risk is also one of the factors that affects the price of the stock. So this is also an important area that investors need to pay attention to before making a decision on any business. Our risks dashboard would have the 3 risks we have identified for Advance NanoTek.
If you decide to trade Advance NanoTek, use the lowest-cost* platform that is rated #1 Overall by Barron’s, Interactive Brokers. Trade stocks, options, futures, forex, bonds and funds on 135 markets, all from a single integrated account. Promoted
New: Manage All Your Stock Portfolios in One Place
We've created the ultimate portfolio companion for stock investors, and it's free.
• Connect an unlimited number of Portfolios and see your total in one currency
• Be alerted to new Warning Signs or Risks via email or mobile
• Track the Fair Value of your stocks
This article by Simply Wall St is general in nature. It does not constitute a recommendation to buy or sell any stock, and does not take account of your objectives, or your financial situation. We aim to bring you long-term focused analysis driven by fundamental data. Note that our analysis may not factor in the latest price-sensitive company announcements or qualitative material. Simply Wall St has no position in any stocks mentioned.
*Interactive Brokers Rated Lowest Cost Broker by StockBrokers.com Annual Online Review 2020
Have feedback on this article? Concerned about the content? Get in touch with us directly. Alternatively, email editorial-team (at) simplywallst.com.
About ASX:ANO
Advance ZincTek
Manufactures aluminum oxide powder, and zinc oxide dispersions and powder for use in the personal care sector in Australia, the United States, Canada, Europe, and internationally.
Flawless balance sheet with questionable track record.
Market Insights

Advertisement
Community Narratives
MicroVision will explode future revenue by 380.37% with a vision towards success
Fair Value US$60.00|98.5% undervalued
TH
Community Contributor
The Indispensable Artery for a New North American Economy
Fair Value CA$132.87|2.3% undervalued
TI
Community Contributor