Advertisement
- Australia
- /
- Metals and Mining
- /
- ASX:AMI
3 ASX Penny Stocks With Market Caps Under A$2B

Simply Wall St
Reviewed by Simply Wall St
As the Australian market edges higher, buoyed by optimism surrounding a potential resolution to the U.S. government shutdown, investors are keenly observing opportunities beyond the usual big names. Penny stocks, often smaller or newer companies, continue to hold relevance for those seeking growth at lower price points. Despite being considered somewhat of an outdated term, these stocks can offer compelling opportunities when backed by strong financials and solid fundamentals.
Top 10 Penny Stocks In Australia
| Name | Share Price | Market Cap | Rewards & Risks |
| Alfabs Australia (ASX:AAL) | A$0.475 | A$136.13M | ✅ 4 ⚠️ 3 View Analysis > |
| Dusk Group (ASX:DSK) | A$0.85 | A$52.93M | ✅ 4 ⚠️ 2 View Analysis > |
| IVE Group (ASX:IGL) | A$3.08 | A$473.37M | ✅ 4 ⚠️ 3 View Analysis > |
| MotorCycle Holdings (ASX:MTO) | A$3.63 | A$267.92M | ✅ 4 ⚠️ 2 View Analysis > |
| West African Resources (ASX:WAF) | A$3.04 | A$3.47B | ✅ 4 ⚠️ 2 View Analysis > |
| LaserBond (ASX:LBL) | A$0.51 | A$60.22M | ✅ 4 ⚠️ 2 View Analysis > |
| Service Stream (ASX:SSM) | A$2.27 | A$1.39B | ✅ 3 ⚠️ 1 View Analysis > |
| Fleetwood (ASX:FWD) | A$2.81 | A$260.15M | ✅ 3 ⚠️ 2 View Analysis > |
| MaxiPARTS (ASX:MXI) | A$2.34 | A$129.97M | ✅ 3 ⚠️ 2 View Analysis > |
| GWA Group (ASX:GWA) | A$2.44 | A$641.15M | ✅ 4 ⚠️ 1 View Analysis > |
Click here to see the full list of 413 stocks from our ASX Penny Stocks screener.
Here's a peek at a few of the choices from the screener.
Aurelia Metals (ASX:AMI)
Simply Wall St Financial Health Rating: ★★★★★☆
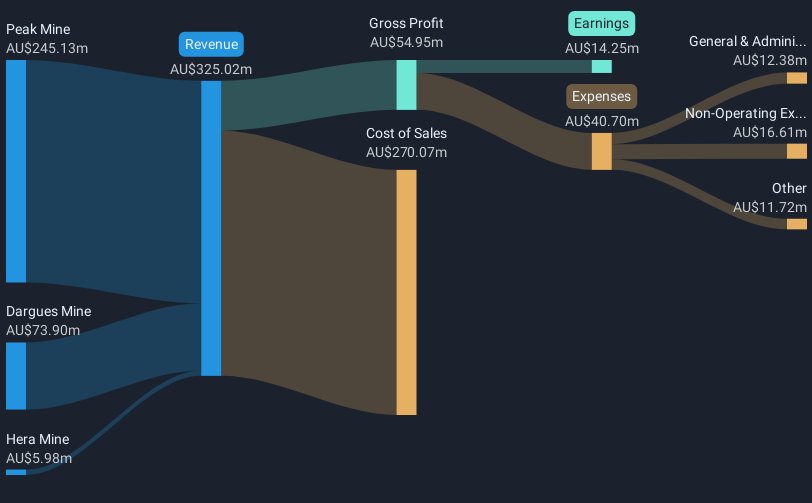
Overview: Aurelia Metals Limited is an Australian company involved in the exploration and production of mineral properties, with a market cap of A$414.68 million.
Operations: The company's revenue is derived from three main segments: Hera Mine generating A$31.32 million, Peak Mine contributing A$290.14 million, and Dargues Mine with A$22.01 million in revenue.
Market Cap: A$414.68M
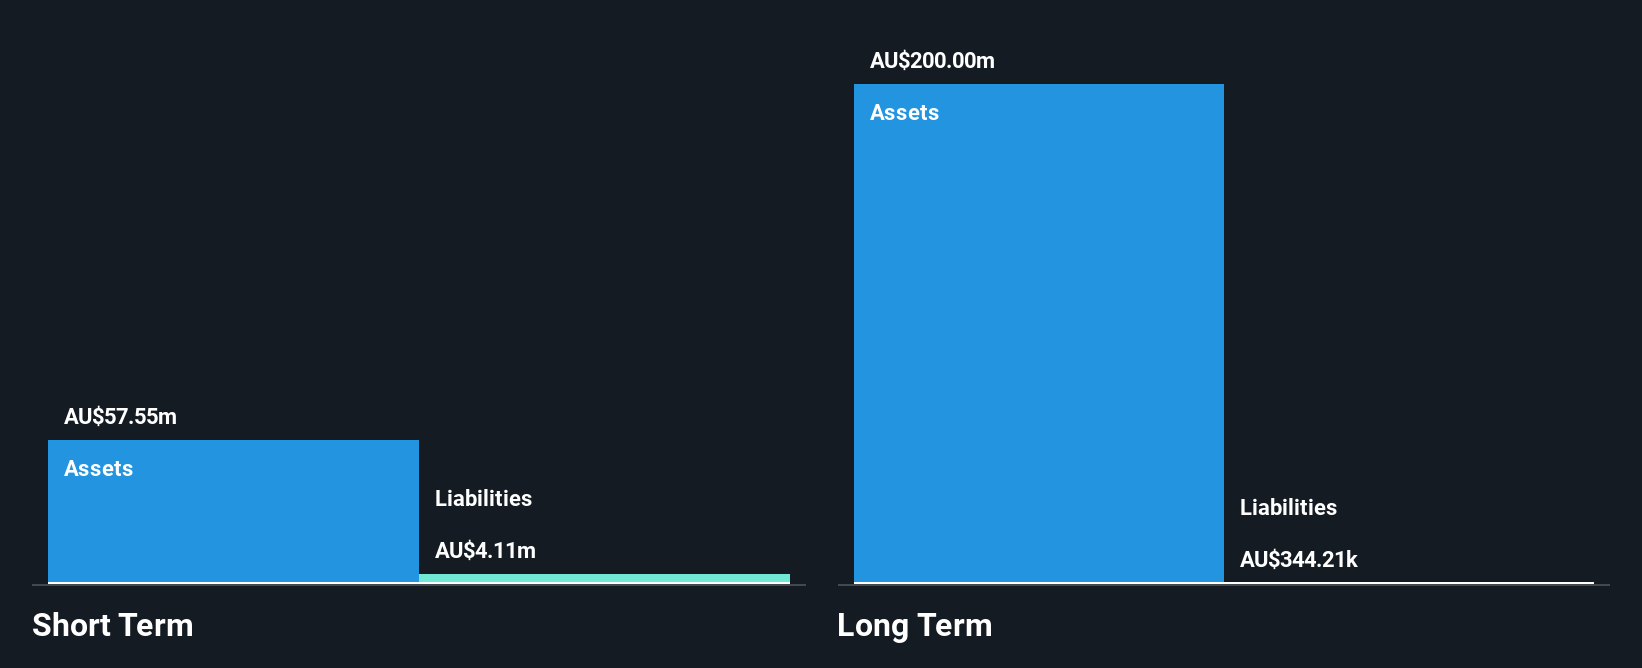
Aurelia Metals Limited, with a market cap of A$414.68 million, is trading at a significant discount to its estimated fair value and has not experienced shareholder dilution over the past year. The company's financial health appears robust, with short-term assets exceeding both short- and long-term liabilities. Although its Return on Equity is considered low at 13.5%, Aurelia has recently turned profitable after reporting A$343.47 million in sales for the fiscal year ending June 2025, alongside a net income of A$48.85 million compared to a loss previously. Recent board changes aim to enhance governance as part of an ongoing renewal process.
- Unlock comprehensive insights into our analysis of Aurelia Metals stock in this financial health report.
- Gain insights into Aurelia Metals' outlook and expected performance with our report on the company's earnings estimates.
Wildcat Resources (ASX:WC8)
Simply Wall St Financial Health Rating: ★★★★★★
Overview: Wildcat Resources Limited is a mineral exploration company in Australia with a market cap of A$288.11 million.
Operations: The company's revenue segment consists of A$1.53 million generated from its operations in Australia.
Market Cap: A$288.11M
Wildcat Resources Limited, with a market cap of A$288.11 million, remains pre-revenue despite reporting A$1.53 million in revenue for the year ending June 2025. The company is unprofitable and faces declining earnings forecasts over the next three years. However, it benefits from being debt-free and has sufficient short-term assets to cover its liabilities comfortably. The management team is relatively new, with an average tenure of 1.8 years, which may impact strategic continuity. Despite stable weekly volatility at 11%, Wildcat's cash runway supports operations for over a year based on current free cash flow trends without significant shareholder dilution recently.
- Get an in-depth perspective on Wildcat Resources' performance by reading our balance sheet health report here.
- Assess Wildcat Resources' future earnings estimates with our detailed growth reports.
Web Travel Group (ASX:WEB)
Simply Wall St Financial Health Rating: ★★★★★☆
Overview: Web Travel Group Limited offers online travel booking services across Australia, the United Arab Emirates, the United Kingdom, and internationally with a market cap of A$1.51 billion.
Operations: The company generates revenue from its Business to Business Travel (B2B) segment, amounting to A$328.4 million.
Market Cap: A$1.51B
Web Travel Group, with a market cap of A$1.51 billion, faces challenges despite its international reach and substantial B2B revenue of A$328.4 million. The company recently reported a significant one-off loss of A$47.2 million, impacting its financial results for the year ending March 2025. Although Web Travel has more cash than debt and good interest coverage, it struggles with low return on equity at 1.9% and declining profit margins from 24.6% to 3.4%. While earnings are forecasted to grow by 32.15% annually, the board's inexperience could affect strategic decisions moving forward.
- Jump into the full analysis health report here for a deeper understanding of Web Travel Group.
- Examine Web Travel Group's earnings growth report to understand how analysts expect it to perform.
Summing It All Up
- Access the full spectrum of 413 ASX Penny Stocks by clicking on this link.
- Ready To Venture Into Other Investment Styles? Trump has pledged to "unleash" American oil and gas and these 22 US stocks have developments that are poised to benefit.
This article by Simply Wall St is general in nature. We provide commentary based on historical data and analyst forecasts only using an unbiased methodology and our articles are not intended to be financial advice. It does not constitute a recommendation to buy or sell any stock, and does not take account of your objectives, or your financial situation. We aim to bring you long-term focused analysis driven by fundamental data. Note that our analysis may not factor in the latest price-sensitive company announcements or qualitative material. Simply Wall St has no position in any stocks mentioned.
New: Manage All Your Stock Portfolios in One Place
We've created the ultimate portfolio companion for stock investors, and it's free.
• Connect an unlimited number of Portfolios and see your total in one currency
• Be alerted to new Warning Signs or Risks via email or mobile
• Track the Fair Value of your stocks
Have feedback on this article? Concerned about the content? Get in touch with us directly. Alternatively, email editorial-team@simplywallst.com
About ASX:AMI
Aurelia Metals
Engages in the exploration and production of mineral properties in Australia.
Very undervalued with excellent balance sheet.
Similar Companies
Market Insights

Advertisement
Community Narratives
The "Molecular Pencil": Why Beam's Technology is Built to Win
Fair Value US$65.01|65.4% undervalued
DA
Community Contributor
The silent giant behind virtually every advanced chip powering AI, smartphones, and modern infrastructure.
Fair Value US$310.00|6.1% undervalued
OS
Community Contributor
ADP Stock: Solid Fundamentals, But AI Investments Test Its Margin Resilience
Fair Value US$387.77|34.2% undervalued
YI
Community Contributor
MINISO's fair value is projected at 26.69 with an anticipated PE ratio shift of 20x
Fair Value US$24.03|9.6% undervalued
BE
Community Contributor