Steadfast Group Limited (ASX:SDF) Stock's Been Sliding But Fundamentals Look Decent: Will The Market Correct The Share Price In The Future?


Steadfast Group (ASX:SDF) has had a rough three months with its share price down 5.9%. However, stock prices are usually driven by a company’s financials over the long term, which in this case look pretty respectable. In this article, we decided to focus on Steadfast Group's ROE.
ROE or return on equity is a useful tool to assess how effectively a company can generate returns on the investment it received from its shareholders. Put another way, it reveals the company's success at turning shareholder investments into profits.
Check out our latest analysis for Steadfast Group
How Is ROE Calculated?
The formula for ROE is:
Return on Equity = Net Profit (from continuing operations) ÷ Shareholders' Equity
So, based on the above formula, the ROE for Steadfast Group is:
9.7% = AU$247m ÷ AU$2.5b (Based on the trailing twelve months to December 2023).
The 'return' is the amount earned after tax over the last twelve months. Another way to think of that is that for every A$1 worth of equity, the company was able to earn A$0.10 in profit.
What Has ROE Got To Do With Earnings Growth?
We have already established that ROE serves as an efficient profit-generating gauge for a company's future earnings. We now need to evaluate how much profit the company reinvests or "retains" for future growth which then gives us an idea about the growth potential of the company. Generally speaking, other things being equal, firms with a high return on equity and profit retention, have a higher growth rate than firms that don’t share these attributes.
A Side By Side comparison of Steadfast Group's Earnings Growth And 9.7% ROE
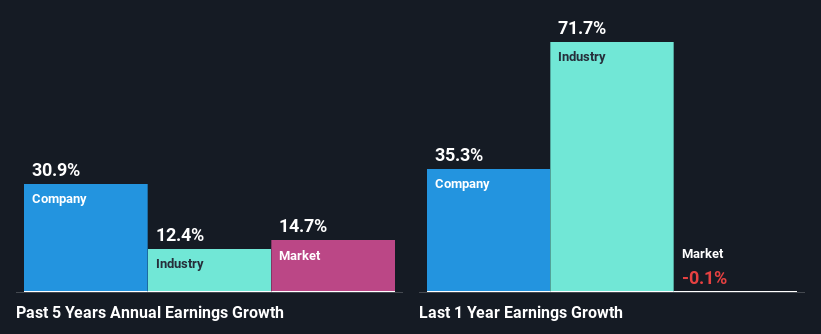
At first glance, Steadfast Group's ROE doesn't look very promising. We then compared the company's ROE to the broader industry and were disappointed to see that the ROE is lower than the industry average of 13%. Despite this, surprisingly, Steadfast Group saw an exceptional 31% net income growth over the past five years. Therefore, there could be other reasons behind this growth. Such as - high earnings retention or an efficient management in place.
Next, on comparing with the industry net income growth, we found that Steadfast Group's growth is quite high when compared to the industry average growth of 12% in the same period, which is great to see.
Earnings growth is a huge factor in stock valuation. The investor should try to establish if the expected growth or decline in earnings, whichever the case may be, is priced in. By doing so, they will have an idea if the stock is headed into clear blue waters or if swampy waters await. What is SDF worth today? The intrinsic value infographic in our free research report helps visualize whether SDF is currently mispriced by the market.
Is Steadfast Group Using Its Retained Earnings Effectively?
The high three-year median payout ratio of 81% (implying that it keeps only 19% of profits) for Steadfast Group suggests that the company's growth wasn't really hampered despite it returning most of the earnings to its shareholders.
Additionally, Steadfast Group has paid dividends over a period of at least ten years which means that the company is pretty serious about sharing its profits with shareholders. Our latest analyst data shows that the future payout ratio of the company is expected to drop to 64% over the next three years. The fact that the company's ROE is expected to rise to 13% over the same period is explained by the drop in the payout ratio.
Summary
In total, it does look like Steadfast Group has some positive aspects to its business. That is, quite an impressive growth in earnings. However, the low profit retention means that the company's earnings growth could have been higher, had it been reinvesting a higher portion of its profits. That being so, a study of the latest analyst forecasts show that the company is expected to see a slowdown in its future earnings growth. To know more about the latest analysts predictions for the company, check out this visualization of analyst forecasts for the company.
New: Manage All Your Stock Portfolios in One Place
We've created the ultimate portfolio companion for stock investors, and it's free.
• Connect an unlimited number of Portfolios and see your total in one currency
• Be alerted to new Warning Signs or Risks via email or mobile
• Track the Fair Value of your stocks
Have feedback on this article? Concerned about the content? Get in touch with us directly. Alternatively, email editorial-team (at) simplywallst.com.
This article by Simply Wall St is general in nature. We provide commentary based on historical data and analyst forecasts only using an unbiased methodology and our articles are not intended to be financial advice. It does not constitute a recommendation to buy or sell any stock, and does not take account of your objectives, or your financial situation. We aim to bring you long-term focused analysis driven by fundamental data. Note that our analysis may not factor in the latest price-sensitive company announcements or qualitative material. Simply Wall St has no position in any stocks mentioned.
About ASX:SDF
Steadfast Group
Provides general insurance brokerage services Australasia, Asia, and Europe.
Excellent balance sheet average dividend payer.

