
Advertisement
The external fund manager backed by Berkshire Hathaway's Charlie Munger, Li Lu, makes no bones about it when he says 'The biggest investment risk is not the volatility of prices, but whether you will suffer a permanent loss of capital.' So it seems the smart money knows that debt - which is usually involved in bankruptcies - is a very important factor, when you assess how risky a company is. We note that Cooper Energy Limited (ASX:COE) does have debt on its balance sheet. But is this debt a concern to shareholders?
When Is Debt Dangerous?
Generally speaking, debt only becomes a real problem when a company can't easily pay it off, either by raising capital or with its own cash flow. In the worst case scenario, a company can go bankrupt if it cannot pay its creditors. However, a more common (but still painful) scenario is that it has to raise new equity capital at a low price, thus permanently diluting shareholders. Having said that, the most common situation is where a company manages its debt reasonably well - and to its own advantage. The first thing to do when considering how much debt a business uses is to look at its cash and debt together.
Check out our latest analysis for Cooper Energy
What Is Cooper Energy's Debt?
As you can see below, at the end of December 2023, Cooper Energy had AU$204.9m of debt, up from AU$144.3m a year ago. Click the image for more detail. However, it also had AU$102.4m in cash, and so its net debt is AU$102.6m.
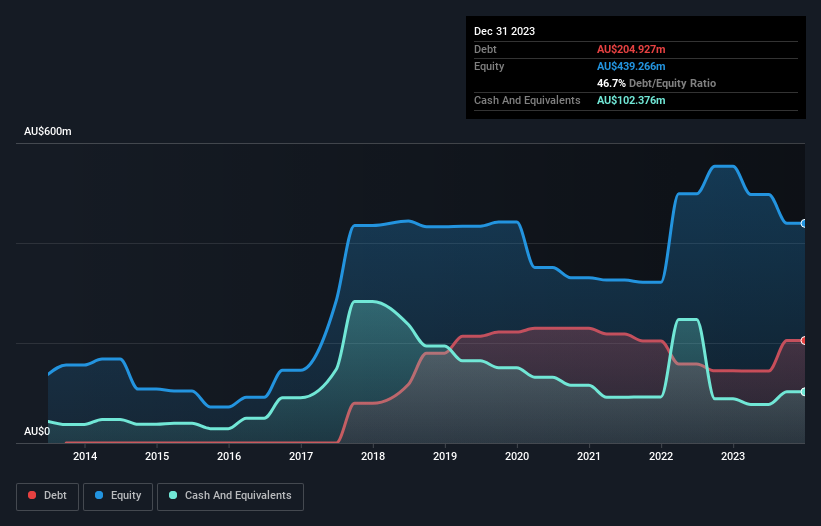
How Strong Is Cooper Energy's Balance Sheet?
Zooming in on the latest balance sheet data, we can see that Cooper Energy had liabilities of AU$257.1m due within 12 months and liabilities of AU$651.5m due beyond that. Offsetting these obligations, it had cash of AU$102.4m as well as receivables valued at AU$23.6m due within 12 months. So it has liabilities totalling AU$782.7m more than its cash and near-term receivables, combined.
Given this deficit is actually higher than the company's market capitalization of AU$528.0m, we think shareholders really should watch Cooper Energy's debt levels, like a parent watching their child ride a bike for the first time. In the scenario where the company had to clean up its balance sheet quickly, it seems likely shareholders would suffer extensive dilution. There's no doubt that we learn most about debt from the balance sheet. But ultimately the future profitability of the business will decide if Cooper Energy can strengthen its balance sheet over time. So if you're focused on the future you can check out this free report showing analyst profit forecasts.
Over 12 months, Cooper Energy made a loss at the EBIT level, and saw its revenue drop to AU$202m, which is a fall of 4.6%. We would much prefer see growth.
Caveat Emptor
Over the last twelve months Cooper Energy produced an earnings before interest and tax (EBIT) loss. Its EBIT loss was a whopping AU$169m. Considering that alongside the liabilities mentioned above make us nervous about the company. It would need to improve its operations quickly for us to be interested in it. Not least because it burned through AU$41m in negative free cash flow over the last year. That means it's on the risky side of things. The balance sheet is clearly the area to focus on when you are analysing debt. However, not all investment risk resides within the balance sheet - far from it. For instance, we've identified 1 warning sign for Cooper Energy that you should be aware of.
At the end of the day, it's often better to focus on companies that are free from net debt. You can access our special list of such companies (all with a track record of profit growth). It's free.
New: Manage All Your Stock Portfolios in One Place
We've created the ultimate portfolio companion for stock investors, and it's free.
• Connect an unlimited number of Portfolios and see your total in one currency
• Be alerted to new Warning Signs or Risks via email or mobile
• Track the Fair Value of your stocks
Have feedback on this article? Concerned about the content? Get in touch with us directly. Alternatively, email editorial-team (at) simplywallst.com.
This article by Simply Wall St is general in nature. We provide commentary based on historical data and analyst forecasts only using an unbiased methodology and our articles are not intended to be financial advice. It does not constitute a recommendation to buy or sell any stock, and does not take account of your objectives, or your financial situation. We aim to bring you long-term focused analysis driven by fundamental data. Note that our analysis may not factor in the latest price-sensitive company announcements or qualitative material. Simply Wall St has no position in any stocks mentioned.
About ASX:AEL
Amplitude Energy
Engages in exploration, development, and production of natural gas and low-cost oil in Australia.
Reasonable growth potential and fair value.
Similar Companies
Market Insights

Advertisement
Community Narratives
The company that turned a verb into a global necessity and basically runs the modern internet, digital ads, smartphones, maps, and AI.
Fair Value US$300.00|7.5% undervalued
OS
Community Contributor
Flowers Foods Pays A Fair Price For Health
Fair Value US$16.12|25.4% undervalued
NV
Community Contributor
TMX Group will thrive with 33.3% profit margin and enduring market moat
Fair Value CA$49.90|3.6% overvalued
LI
Community Contributor
The "Molecular Pencil": Why Beam's Technology is Built to Win
Fair Value US$65.01|65.0% undervalued
DA
Community Contributor