
Advertisement
- Australia
- /
- Capital Markets
- /
- ASX:PDL
Can You Imagine How Pendal Group's (ASX:PDL) Shareholders Feel About The 72% Share Price Increase?
If you want to compound wealth in the stock market, you can do so by buying an index fund. But one can do better than that by picking better than average stocks (as part of a diversified portfolio). To wit, the Pendal Group Limited (ASX:PDL) share price is 72% higher than it was a year ago, much better than the market return of around 48% (not including dividends) in the same period. So that should have shareholders smiling. Unfortunately the longer term returns are not so good, with the stock falling 38% in the last three years.
View our latest analysis for Pendal Group
While the efficient markets hypothesis continues to be taught by some, it has been proven that markets are over-reactive dynamic systems, and investors are not always rational. One imperfect but simple way to consider how the market perception of a company has shifted is to compare the change in the earnings per share (EPS) with the share price movement.
Over the last twelve months, Pendal Group actually shrank its EPS by 27%.
So we don't think that investors are paying too much attention to EPS. Therefore, it seems likely that investors are putting more weight on metrics other than EPS, at the moment.
Absent any improvement, we don't think a thirst for dividends is pushing up the Pendal Group's share price. Revenue actually dropped 9.2% over last year. Usually that correlates with a lower share price, but let's face it, the gyrations of the market are sometimes only as clear as mud.
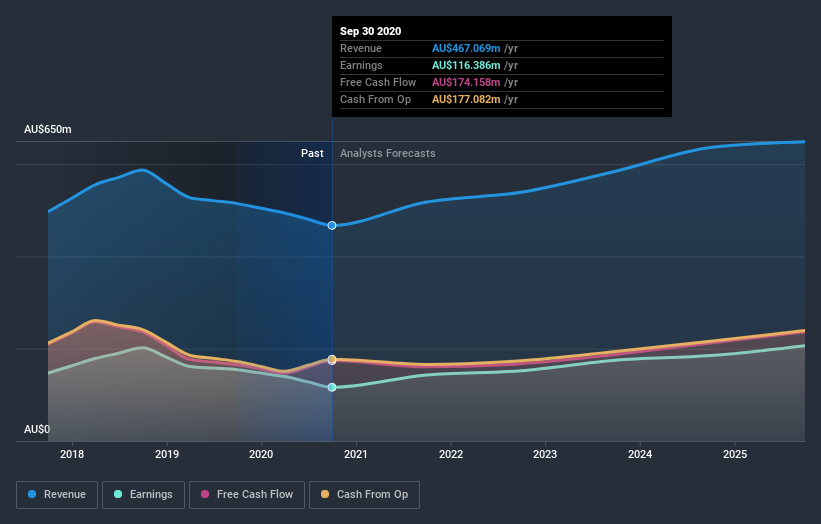
The company's revenue and earnings (over time) are depicted in the image below (click to see the exact numbers).
Pendal Group is well known by investors, and plenty of clever analysts have tried to predict the future profit levels. Given we have quite a good number of analyst forecasts, it might be well worth checking out this free chart depicting consensus estimates.
What About Dividends?
When looking at investment returns, it is important to consider the difference between total shareholder return (TSR) and share price return. Whereas the share price return only reflects the change in the share price, the TSR includes the value of dividends (assuming they were reinvested) and the benefit of any discounted capital raising or spin-off. It's fair to say that the TSR gives a more complete picture for stocks that pay a dividend. We note that for Pendal Group the TSR over the last year was 81%, which is better than the share price return mentioned above. This is largely a result of its dividend payments!
A Different Perspective
It's nice to see that Pendal Group shareholders have received a total shareholder return of 81% over the last year. Of course, that includes the dividend. There's no doubt those recent returns are much better than the TSR loss of 4% per year over five years. We generally put more weight on the long term performance over the short term, but the recent improvement could hint at a (positive) inflection point within the business. While it is well worth considering the different impacts that market conditions can have on the share price, there are other factors that are even more important. Case in point: We've spotted 2 warning signs for Pendal Group you should be aware of.
If you are like me, then you will not want to miss this free list of growing companies that insiders are buying.
Please note, the market returns quoted in this article reflect the market weighted average returns of stocks that currently trade on AU exchanges.
If you decide to trade Pendal Group, use the lowest-cost* platform that is rated #1 Overall by Barron’s, Interactive Brokers. Trade stocks, options, futures, forex, bonds and funds on 135 markets, all from a single integrated account. Promoted
New: Manage All Your Stock Portfolios in One Place
We've created the ultimate portfolio companion for stock investors, and it's free.
• Connect an unlimited number of Portfolios and see your total in one currency
• Be alerted to new Warning Signs or Risks via email or mobile
• Track the Fair Value of your stocks
This article by Simply Wall St is general in nature. It does not constitute a recommendation to buy or sell any stock, and does not take account of your objectives, or your financial situation. We aim to bring you long-term focused analysis driven by fundamental data. Note that our analysis may not factor in the latest price-sensitive company announcements or qualitative material. Simply Wall St has no position in any stocks mentioned.
*Interactive Brokers Rated Lowest Cost Broker by StockBrokers.com Annual Online Review 2020
Have feedback on this article? Concerned about the content? Get in touch with us directly. Alternatively, email editorial-team (at) simplywallst.com.
About ASX:PDL
Pendal Group
Pendal Group Limited is a publicly owned investment manager the firm provides its services to individual and institutional clients.
Excellent balance sheet average dividend payer.
Similar Companies
Market Insights

Advertisement
Weekly Picks
FA

FAI on Arabian Internet and Communication Services ·
Solutions by stc: 34% Upside in Saudi's Digital Transformation Leader
Fair Value:ر.س342.2335.3% undervalued
9 followersusers have followed this narrative
1 commentusers have commented on this narrative
3 likesusers have liked this narrative
RO


RobertoAllende on NVIDIA ·
The AI Infrastructure Giant Grows Into Its Valuation
Fair Value:US$345.0747.9% undervalued
27 followersusers have followed this narrative
28 commentsusers have commented on this narrative
21 likesusers have liked this narrative
Recently Updated Narratives
HA

Haha94 on Perdana Petroleum Berhad ·
Perdana Petroleum Berhad is a Zombie Business with a 27.34% Profit Margin and inflation adjusted revenue Business
Fair Value:RM 0.2128.6% undervalued
1 followerusers have followed this narrative
0 commentsusers have commented on this narrative
0 likesusers have liked this narrative
AB
Abc on Global X Etfs Icav - Global X Silver Miners Ucits ETF ·
Many trends acting at the same time
Fair Value:€10068.5% undervalued
1 followerusers have followed this narrative
0 commentsusers have commented on this narrative
0 likesusers have liked this narrative
NI


niteco on Texas Instruments ·
Engineered for Stability. Positioned for Growth.
Fair Value:US$314.4446.5% undervalued
2 followersusers have followed this narrative
0 commentsusers have commented on this narrative
0 likesusers have liked this narrative
Popular Narratives
TH

TheWallstreetKing on MicroVision ·
MicroVision will explode future revenue by 380.37% with a vision towards success
Fair Value:US$6098.6% undervalued
109 followersusers have followed this narrative
11 commentsusers have commented on this narrative
22 likesusers have liked this narrative
AN

AnalystConsensusTarget on NVIDIA ·
NVDA: Expanding AI Demand Will Drive Major Data Center Investments Through 2026
Fair Value:US$250.3928.1% undervalued
941 followersusers have followed this narrative
6 commentsusers have commented on this narrative
24 likesusers have liked this narrative
OS


oscargarcia on Alphabet ·
The company that turned a verb into a global necessity and basically runs the modern internet, digital ads, smartphones, maps, and AI.
Fair Value:US$3407.4% undervalued
145 followersusers have followed this narrative
6 commentsusers have commented on this narrative
18 likesusers have liked this narrative