- Australia
- /
- Capital Markets
- /
- ASX:MFG
Magellan Financial Group's (ASX:MFG) earnings have declined over five years, contributing to shareholders 75% loss


Magellan Financial Group Limited (ASX:MFG) shareholders should be happy to see the share price up 21% in the last month. But will that heal all the wounds inflicted over 5 years of declines? Unlikely. Like a ship taking on water, the share price has sunk 83% in that time. It's true that the recent bounce could signal the company is turning over a new leaf, but we are not so sure. The fundamental business performance will ultimately determine if the turnaround can be sustained. We really feel for shareholders in this scenario. It's a good reminder of the importance of diversification, and it's worth keeping in mind there's more to life than money, anyway.
While the stock has risen 6.0% in the past week but long term shareholders are still in the red, let's see what the fundamentals can tell us.
See our latest analysis for Magellan Financial Group
In his essay The Superinvestors of Graham-and-Doddsville Warren Buffett described how share prices do not always rationally reflect the value of a business. One imperfect but simple way to consider how the market perception of a company has shifted is to compare the change in the earnings per share (EPS) with the share price movement.
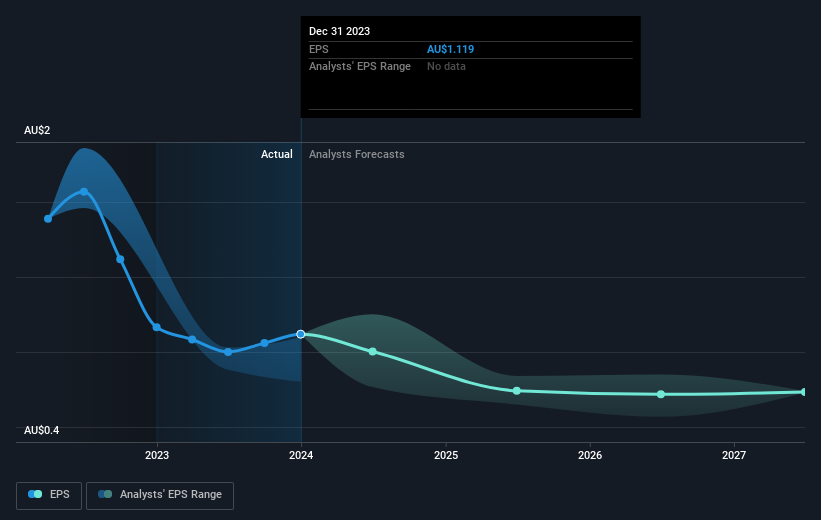
Looking back five years, both Magellan Financial Group's share price and EPS declined; the latter at a rate of 9.9% per year. Readers should note that the share price has fallen faster than the EPS, at a rate of 30% per year, over the period. This implies that the market is more cautious about the business these days. The low P/E ratio of 9.10 further reflects this reticence.
You can see how EPS has changed over time in the image below (click on the chart to see the exact values).
We consider it positive that insiders have made significant purchases in the last year. Even so, future earnings will be far more important to whether current shareholders make money. This free interactive report on Magellan Financial Group's earnings, revenue and cash flow is a great place to start, if you want to investigate the stock further.
What About Dividends?
As well as measuring the share price return, investors should also consider the total shareholder return (TSR). The TSR incorporates the value of any spin-offs or discounted capital raisings, along with any dividends, based on the assumption that the dividends are reinvested. Arguably, the TSR gives a more comprehensive picture of the return generated by a stock. In the case of Magellan Financial Group, it has a TSR of -75% for the last 5 years. That exceeds its share price return that we previously mentioned. The dividends paid by the company have thusly boosted the total shareholder return.
A Different Perspective
We're pleased to report that Magellan Financial Group shareholders have received a total shareholder return of 20% over one year. Of course, that includes the dividend. There's no doubt those recent returns are much better than the TSR loss of 12% per year over five years. We generally put more weight on the long term performance over the short term, but the recent improvement could hint at a (positive) inflection point within the business. I find it very interesting to look at share price over the long term as a proxy for business performance. But to truly gain insight, we need to consider other information, too. Like risks, for instance. Every company has them, and we've spotted 3 warning signs for Magellan Financial Group (of which 1 can't be ignored!) you should know about.
There are plenty of other companies that have insiders buying up shares. You probably do not want to miss this free list of undervalued small cap companies that insiders are buying.
Please note, the market returns quoted in this article reflect the market weighted average returns of stocks that currently trade on Australian exchanges.
New: Manage All Your Stock Portfolios in One Place
We've created the ultimate portfolio companion for stock investors, and it's free.
• Connect an unlimited number of Portfolios and see your total in one currency
• Be alerted to new Warning Signs or Risks via email or mobile
• Track the Fair Value of your stocks
Have feedback on this article? Concerned about the content? Get in touch with us directly. Alternatively, email editorial-team (at) simplywallst.com.
This article by Simply Wall St is general in nature. We provide commentary based on historical data and analyst forecasts only using an unbiased methodology and our articles are not intended to be financial advice. It does not constitute a recommendation to buy or sell any stock, and does not take account of your objectives, or your financial situation. We aim to bring you long-term focused analysis driven by fundamental data. Note that our analysis may not factor in the latest price-sensitive company announcements or qualitative material. Simply Wall St has no position in any stocks mentioned.
Have feedback on this article? Concerned about the content? Get in touch with us directly. Alternatively, email editorial-team@simplywallst.com
About ASX:MFG
Flawless balance sheet, undervalued and pays a dividend.

