Stock Analysis
- Australia
- /
- Consumer Finance
- /
- ASX:HUM
Humm Group (ASX:HUM) five-year losses have grown faster than shareholder returns have fallen, but the stock pops 19% this past week

Humm Group Limited (ASX:HUM) shareholders will doubtless be very grateful to see the share price up 55% in the last quarter. But if you look at the last five years the returns have not been good. In fact, the share price is down 50%, which falls well short of the return you could get by buying an index fund.
The recent uptick of 19% could be a positive sign of things to come, so let's take a look at historical fundamentals.
Check out our latest analysis for Humm Group
While markets are a powerful pricing mechanism, share prices reflect investor sentiment, not just underlying business performance. One flawed but reasonable way to assess how sentiment around a company has changed is to compare the earnings per share (EPS) with the share price.
We know that Humm Group has been profitable in the past. On the other hand, it reported a trailing twelve months loss, suggesting it isn't reliably profitable. Other metrics may better explain the share price move.
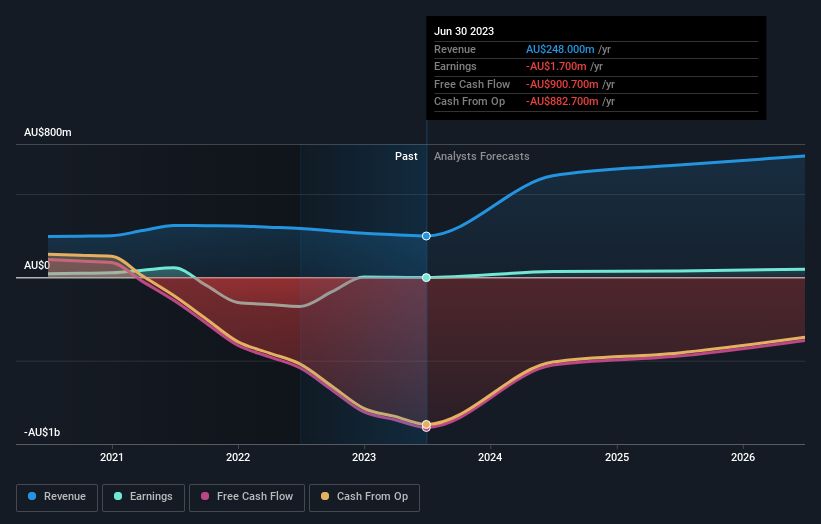
The revenue decline of 1.0% isn't too bad. But it's quite possible the market had expected better; a closer look at the revenue trends might explain the pessimism.
You can see below how earnings and revenue have changed over time (discover the exact values by clicking on the image).
We like that insiders have been buying shares in the last twelve months. Even so, future earnings will be far more important to whether current shareholders make money. So it makes a lot of sense to check out what analysts think Humm Group will earn in the future (free profit forecasts).
What About Dividends?
As well as measuring the share price return, investors should also consider the total shareholder return (TSR). Whereas the share price return only reflects the change in the share price, the TSR includes the value of dividends (assuming they were reinvested) and the benefit of any discounted capital raising or spin-off. It's fair to say that the TSR gives a more complete picture for stocks that pay a dividend. As it happens, Humm Group's TSR for the last 5 years was -40%, which exceeds the share price return mentioned earlier. And there's no prize for guessing that the dividend payments largely explain the divergence!
A Different Perspective
We're pleased to report that Humm Group shareholders have received a total shareholder return of 14% over one year. And that does include the dividend. Notably the five-year annualised TSR loss of 7% per year compares very unfavourably with the recent share price performance. This makes us a little wary, but the business might have turned around its fortunes. I find it very interesting to look at share price over the long term as a proxy for business performance. But to truly gain insight, we need to consider other information, too. Consider for instance, the ever-present spectre of investment risk. We've identified 2 warning signs with Humm Group , and understanding them should be part of your investment process.
If you like to buy stocks alongside management, then you might just love this free list of companies. (Hint: insiders have been buying them).
Please note, the market returns quoted in this article reflect the market weighted average returns of stocks that currently trade on Australian exchanges.
Valuation is complex, but we're helping make it simple.
Find out whether Humm Group is potentially over or undervalued by checking out our comprehensive analysis, which includes fair value estimates, risks and warnings, dividends, insider transactions and financial health.
View the Free AnalysisHave feedback on this article? Concerned about the content? Get in touch with us directly. Alternatively, email editorial-team (at) simplywallst.com.
This article by Simply Wall St is general in nature. We provide commentary based on historical data and analyst forecasts only using an unbiased methodology and our articles are not intended to be financial advice. It does not constitute a recommendation to buy or sell any stock, and does not take account of your objectives, or your financial situation. We aim to bring you long-term focused analysis driven by fundamental data. Note that our analysis may not factor in the latest price-sensitive company announcements or qualitative material. Simply Wall St has no position in any stocks mentioned.
About ASX:HUM
Humm Group
Humm Group Limited provides various financial services in Australia, New Zealand, Ireland, the United Kingdom, and Canada.
Reasonable growth potential and fair value.

