David Iben put it well when he said, 'Volatility is not a risk we care about. What we care about is avoiding the permanent loss of capital.' So it seems the smart money knows that debt - which is usually involved in bankruptcies - is a very important factor, when you assess how risky a company is. We note that Webjet Limited (ASX:WEB) does have debt on its balance sheet. But the real question is whether this debt is making the company risky.
When Is Debt A Problem?
Debt is a tool to help businesses grow, but if a business is incapable of paying off its lenders, then it exists at their mercy. If things get really bad, the lenders can take control of the business. While that is not too common, we often do see indebted companies permanently diluting shareholders because lenders force them to raise capital at a distressed price. By replacing dilution, though, debt can be an extremely good tool for businesses that need capital to invest in growth at high rates of return. When we think about a company's use of debt, we first look at cash and debt together.
See our latest analysis for Webjet
How Much Debt Does Webjet Carry?
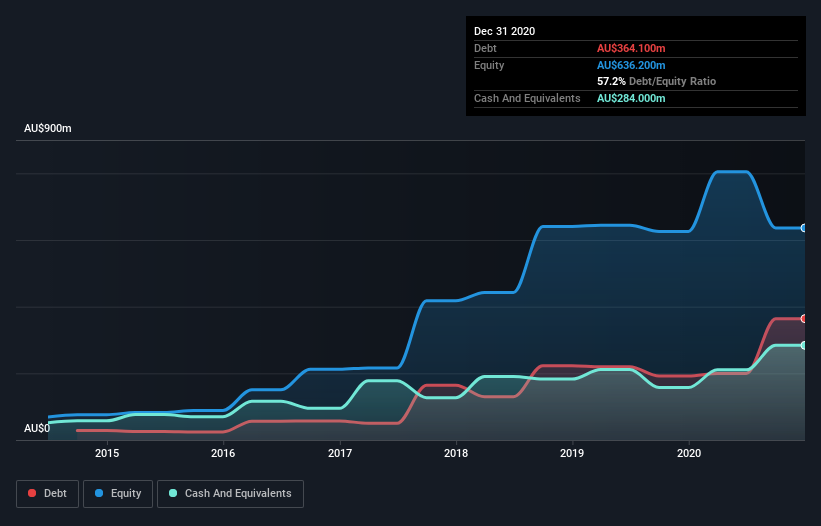
You can click the graphic below for the historical numbers, but it shows that as of December 2020 Webjet had AU$352.8m of debt, an increase on AU$191.7m, over one year. On the flip side, it has AU$284.0m in cash leading to net debt of about AU$68.8m.

How Healthy Is Webjet's Balance Sheet?
Zooming in on the latest balance sheet data, we can see that Webjet had liabilities of AU$176.9m due within 12 months and liabilities of AU$407.6m due beyond that. Offsetting this, it had AU$284.0m in cash and AU$24.9m in receivables that were due within 12 months. So its liabilities outweigh the sum of its cash and (near-term) receivables by AU$275.6m.
Since publicly traded Webjet shares are worth a total of AU$1.95b, it seems unlikely that this level of liabilities would be a major threat. Having said that, it's clear that we should continue to monitor its balance sheet, lest it change for the worse. The balance sheet is clearly the area to focus on when you are analysing debt. But it is future earnings, more than anything, that will determine Webjet's ability to maintain a healthy balance sheet going forward. So if you want to see what the professionals think, you might find this free report on analyst profit forecasts to be interesting.
Over 12 months, Webjet made a loss at the EBIT level, and saw its revenue drop to AU$72m, which is a fall of 82%. To be frank that doesn't bode well.
Caveat Emptor
While Webjet's falling revenue is about as heartwarming as a wet blanket, arguably its earnings before interest and tax (EBIT) loss is even less appealing. Its EBIT loss was a whopping AU$234m. When we look at that and recall the liabilities on its balance sheet, relative to cash, it seems unwise to us for the company to have any debt. So we think its balance sheet is a little strained, though not beyond repair. Another cause for caution is that is bled AU$296m in negative free cash flow over the last twelve months. So suffice it to say we consider the stock very risky. There's no doubt that we learn most about debt from the balance sheet. However, not all investment risk resides within the balance sheet - far from it. For example Webjet has 3 warning signs (and 1 which makes us a bit uncomfortable) we think you should know about.
If you're interested in investing in businesses that can grow profits without the burden of debt, then check out this free list of growing businesses that have net cash on the balance sheet.
If you decide to trade Webjet, use the lowest-cost* platform that is rated #1 Overall by Barron’s, Interactive Brokers. Trade stocks, options, futures, forex, bonds and funds on 135 markets, all from a single integrated account. Promoted
Valuation is complex, but we're here to simplify it.
Discover if Web Travel Group might be undervalued or overvalued with our detailed analysis, featuring fair value estimates, potential risks, dividends, insider trades, and its financial condition.
Access Free AnalysisThis article by Simply Wall St is general in nature. It does not constitute a recommendation to buy or sell any stock, and does not take account of your objectives, or your financial situation. We aim to bring you long-term focused analysis driven by fundamental data. Note that our analysis may not factor in the latest price-sensitive company announcements or qualitative material. Simply Wall St has no position in any stocks mentioned.
*Interactive Brokers Rated Lowest Cost Broker by StockBrokers.com Annual Online Review 2020
Have feedback on this article? Concerned about the content? Get in touch with us directly. Alternatively, email editorial-team (at) simplywallst.com.
About ASX:WEB
Web Travel Group
Provides online travel booking services in Australia, the United Arab Emirates, the United Kingdom, and internationally.
Excellent balance sheet with reasonable growth potential.
Similar Companies
Market Insights
Community Narratives


