
Advertisement
- Australia
- /
- Consumer Services
- /
- ASX:MPA
Slammed 26% Mad Paws Holdings Limited (ASX:MPA) Screens Well Here But There Might Be A Catch
Mad Paws Holdings Limited (ASX:MPA) shareholders won't be pleased to see that the share price has had a very rough month, dropping 26% and undoing the prior period's positive performance. Instead of being rewarded, shareholders who have already held through the last twelve months are now sitting on a 35% share price drop.
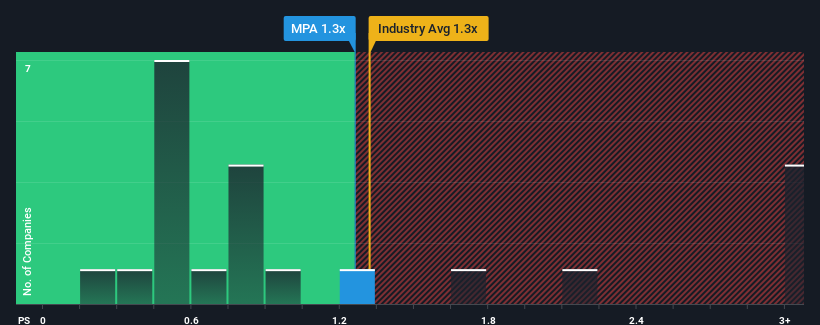
In spite of the heavy fall in price, you could still be forgiven for feeling indifferent about Mad Paws Holdings' P/S ratio of 1.3x, since the median price-to-sales (or "P/S") ratio for the Consumer Services industry in Australia is also close to 0.8x. However, investors might be overlooking a clear opportunity or potential setback if there is no rational basis for the P/S.
Check out our latest analysis for Mad Paws Holdings
What Does Mad Paws Holdings' Recent Performance Look Like?
Recent times have been advantageous for Mad Paws Holdings as its revenues have been rising faster than most other companies. Perhaps the market is expecting this level of performance to taper off, keeping the P/S from soaring. If you like the company, you'd be hoping this isn't the case so that you could potentially pick up some stock while it's not quite in favour.
Want the full picture on analyst estimates for the company? Then our free report on Mad Paws Holdings will help you uncover what's on the horizon.Is There Some Revenue Growth Forecasted For Mad Paws Holdings?
Mad Paws Holdings' P/S ratio would be typical for a company that's only expected to deliver moderate growth, and importantly, perform in line with the industry.
Taking a look back first, we see that the company grew revenue by an impressive 46% last year. The latest three year period has also seen an incredible overall rise in revenue, aided by its incredible short-term performance. So we can start by confirming that the company has done a tremendous job of growing revenue over that time.
Turning to the outlook, the next year should generate growth of 24% as estimated by the one analyst watching the company. With the industry only predicted to deliver 11%, the company is positioned for a stronger revenue result.
With this information, we find it interesting that Mad Paws Holdings is trading at a fairly similar P/S compared to the industry. Apparently some shareholders are skeptical of the forecasts and have been accepting lower selling prices.
The Key Takeaway
Following Mad Paws Holdings' share price tumble, its P/S is just clinging on to the industry median P/S. We'd say the price-to-sales ratio's power isn't primarily as a valuation instrument but rather to gauge current investor sentiment and future expectations.
Looking at Mad Paws Holdings' analyst forecasts revealed that its superior revenue outlook isn't giving the boost to its P/S that we would've expected. There could be some risks that the market is pricing in, which is preventing the P/S ratio from matching the positive outlook. It appears some are indeed anticipating revenue instability, because these conditions should normally provide a boost to the share price.
Before you settle on your opinion, we've discovered 2 warning signs for Mad Paws Holdings that you should be aware of.
If these risks are making you reconsider your opinion on Mad Paws Holdings, explore our interactive list of high quality stocks to get an idea of what else is out there.
New: Manage All Your Stock Portfolios in One Place
We've created the ultimate portfolio companion for stock investors, and it's free.
• Connect an unlimited number of Portfolios and see your total in one currency
• Be alerted to new Warning Signs or Risks via email or mobile
• Track the Fair Value of your stocks
Have feedback on this article? Concerned about the content? Get in touch with us directly. Alternatively, email editorial-team (at) simplywallst.com.
This article by Simply Wall St is general in nature. We provide commentary based on historical data and analyst forecasts only using an unbiased methodology and our articles are not intended to be financial advice. It does not constitute a recommendation to buy or sell any stock, and does not take account of your objectives, or your financial situation. We aim to bring you long-term focused analysis driven by fundamental data. Note that our analysis may not factor in the latest price-sensitive company announcements or qualitative material. Simply Wall St has no position in any stocks mentioned.
About ASX:MPA
Adequate balance sheet and slightly overvalued.
Similar Companies
Market Insights

Advertisement
Community Narratives
MicroVision will explode future revenue by 380.37% with a vision towards success
Fair Value US$60.00|98.4% undervalued
TH
Community Contributor
The Indispensable Artery for a New North American Economy
Fair Value CA$132.87|1.1% undervalued
TI
Community Contributor