- Australia
- /
- Consumer Services
- /
- ASX:MPA
Market Participants Recognise Mad Paws Holdings Limited's (ASX:MPA) Revenues
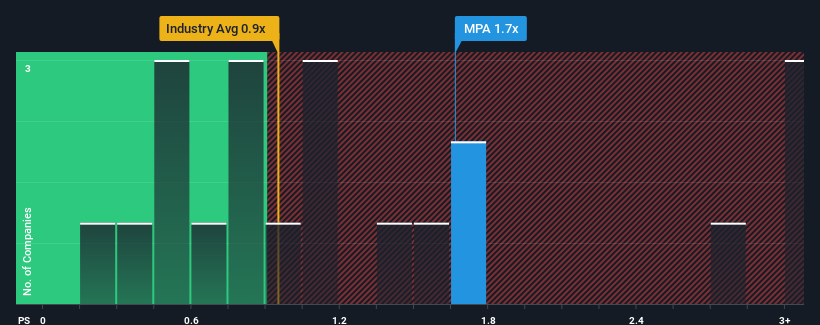
Mad Paws Holdings Limited's (ASX:MPA) price-to-sales (or "P/S") ratio of 1.7x may not look like an appealing investment opportunity when you consider close to half the companies in the Consumer Services industry in Australia have P/S ratios below 0.9x. Nonetheless, we'd need to dig a little deeper to determine if there is a rational basis for the elevated P/S.
See our latest analysis for Mad Paws Holdings

What Does Mad Paws Holdings' Recent Performance Look Like?
Mad Paws Holdings certainly has been doing a good job lately as it's been growing revenue more than most other companies. It seems that many are expecting the strong revenue performance to persist, which has raised the P/S. You'd really hope so, otherwise you're paying a pretty hefty price for no particular reason.
Want the full picture on analyst estimates for the company? Then our free report on Mad Paws Holdings will help you uncover what's on the horizon.How Is Mad Paws Holdings' Revenue Growth Trending?
There's an inherent assumption that a company should outperform the industry for P/S ratios like Mad Paws Holdings' to be considered reasonable.
If we review the last year of revenue growth, the company posted a terrific increase of 150%. The latest three year period has also seen an incredible overall rise in revenue, aided by its incredible short-term performance. Therefore, it's fair to say the revenue growth recently has been superb for the company.
Turning to the outlook, the next three years should generate growth of 19% per annum as estimated by the sole analyst watching the company. Meanwhile, the rest of the industry is forecast to only expand by 12% per year, which is noticeably less attractive.
With this information, we can see why Mad Paws Holdings is trading at such a high P/S compared to the industry. It seems most investors are expecting this strong future growth and are willing to pay more for the stock.
What Does Mad Paws Holdings' P/S Mean For Investors?
Generally, our preference is to limit the use of the price-to-sales ratio to establishing what the market thinks about the overall health of a company.
We've established that Mad Paws Holdings maintains its high P/S on the strength of its forecasted revenue growth being higher than the the rest of the Consumer Services industry, as expected. It appears that shareholders are confident in the company's future revenues, which is propping up the P/S. It's hard to see the share price falling strongly in the near future under these circumstances.
It is also worth noting that we have found 3 warning signs for Mad Paws Holdings that you need to take into consideration.
If these risks are making you reconsider your opinion on Mad Paws Holdings, explore our interactive list of high quality stocks to get an idea of what else is out there.
New: Manage All Your Stock Portfolios in One Place
We've created the ultimate portfolio companion for stock investors, and it's free.
• Connect an unlimited number of Portfolios and see your total in one currency
• Be alerted to new Warning Signs or Risks via email or mobile
• Track the Fair Value of your stocks
Have feedback on this article? Concerned about the content? Get in touch with us directly. Alternatively, email editorial-team (at) simplywallst.com.
This article by Simply Wall St is general in nature. We provide commentary based on historical data and analyst forecasts only using an unbiased methodology and our articles are not intended to be financial advice. It does not constitute a recommendation to buy or sell any stock, and does not take account of your objectives, or your financial situation. We aim to bring you long-term focused analysis driven by fundamental data. Note that our analysis may not factor in the latest price-sensitive company announcements or qualitative material. Simply Wall St has no position in any stocks mentioned.
About ASX:MPA
Adequate balance sheet and slightly overvalued.
Similar Companies
Market Insights
Community Narratives


